Objective: To assess the demographic features of Metabolic Syndrome and the prevalence of composite cardiovascular disease (ischemic heart disease and stroke) and predictor factors in a Jordanian cohort with metabolic syndrome.
Methods: We studied a Jordanian cohort who fulfilled the National Cholesterol Education Program and the Adult Treatment Panel III criteria for metabolic syndrome. This cohort was evaluated at the outpatient clinics for the five metabolic syndrome components, the presence of ischemic heart disease and/or stroke. The cohort was divided into two groups according to gender, age by decade and the presence of overt diabetes. Comparative studies among the two study groups to compare the means and assessment of the metabolic syndrome components for prediction of cardiovascular disease was carried out.
Results: Three hundred and fifty eight (207 males and 151 females) patients fulfilled the Adult Treatment Panel III criteria, 226 patients were type II diabetics on treatment. Hypertriglyceridemia was the most frequent feature of metabolic syndrome encountered followed by hypertension, high fasting blood sugar, high waist circumference (>102 cm) and low high density lipoprotein in descending disorder. There was no difference between the groups with regard to waist circumference but females had the worst lipid profile compared to males. Diabetic males however were having more metabolic syndrome components and diabetics were having more cardiovascular disease than other groups. Using univariate analysis, waist circumference and fasting blood sugar were found to be strong predictors of composite cardiovascular disease and ischemic heart disease but not stroke.
Conclusions: We conclude that diabetics with metabolic syndrome have the worst cardiovascular disease composite end point and females have the worse lipid profile in comparison to males. Waist circumference and fasting blood sugar are the strongest predictors of ischemic heart disease (and composite cardiovascular disease). Further larger controlled studies are needed to reveal whether there is difference in the stroke prevalence.
Key words: Adult Treatment Panel III, diabetes mellitus, gender, lipids, metabolic syndrome, waist circumference
JRMS August 2009; 16(2): 5-11
IntroductionThe metabolic syndrome is a widely prevalent and multi-factorial disorder that presents in a distinct, albeit heterogeneous phenotype.(1)
Although obesity and insulin resistance are not synonymous with the metabolic syndrome, they are integral features in this derangement of adipocyte physiology and carbohydrate metabolism. It is now established that this syndrome predicts the development of type II diabetes mellitus and cardiovascular disease.(1)
Metabolic syndrome was initially observed in 1923 by Kyln, who described the clustering of hypertension, hyperglycemia and gout as the syndrome. Subsequently, several other metabolic abnormalities have been associated with this syndrome, including obesity, microalbuminuria, and abnormalities in fibrinolysis and coagulation.(2)
In 1988, Reaven reintroduced the concept of Syndrome X for the clustering of cardiovascular risk factors like hypertension, glucose intolerance, high triglycerides and low high density lipoprotein concentration.(3)
In 1998, WHO proposed a unifying definition for the syndrome and chose to call it the 'metabolic syndrome' rather than the 'insulin resistance syndrome'.(4) This name was chosen primarily because it was the cause of all the components of the syndrome. The Third Report of the National Cholesterol Education Program (NCEP) Adult Treatment Panel (ATP III) included clinical diagnosis guidelines for the Metabolic Syndrome. Compared with findings from earlier studies and WHO guidelines the new ATP III defines criteria measured in clinical practice.(1,4,5)
Individuals who met the criteria for high blood pressure or high fasting glucose concentration if they are currently using blood pressure medications or oral hypoglycemic agents were also included in the definition.
The study results based on third National Health and Nutrition Examination Survey (NHANES III), indicate that approximately one fourth of the US adults 20 years or older meet the diagnostic criteria for metabolic syndrome.(6) The prevalence of the metabolic syndrome depends on age, ethnic background, and gender. It rises linearly from 20 to 50 years and plateaus thereafter. Looking at various studies around the world, which included population samples, aged from 20 to 25 and upwards, the prevalence varies from 8% (India) to 24% (United States) in men and from 7% (France) to 46% (India) in women.(6-8)
In a UK population-based cross-sectional study by Tillin et al(9) the prevalence of metabolic syndrome was highest in South Asians (WHO, men 46%, women 31%; NCEP, men 29%, women 32%) and lowest in European women (WHO, 9%; NCEP, 14%).
In a European study, the overall prevalence of the metabolic syndrome in nondiabetic adults is 15%. They found that the nondiabetic persons with metabolic syndrome have an increased risk of death from all causes as well as cardiovascular disease.(10)
The prevalence of the Metabolic Syndrome using the International Diabetes Federation (IDF) criteria in Tunisia for a Cohort above 40 years of age was found to be 45.5%; 55.8% in women and 30.0% in men (P < 0.001), higher than the rates of 28.7% (WHO) and 24.3% (NECP ATPIII) using the previous definitions.(11)
Arabs living in Israel had a metabolic syndrome rate of 48% according to criteria of the U.S. National Cholesterol Education Program.(12) The age-adjusted prevalence of the metabolic syndrome in Arab Americans was 23% by the ATP III definition and 28% by the WHO definition.(13) The age-adjusted prevalence of the Metabolic Syndrome in the West Bank of Jordan as defined by the WHO was 17 %.(14)
The prevalence of metabolic syndrome in Saudi Arabia is 39.3%. Age adjusted prevalence in males is 37.2% and crude prevalence is 40.9%, while females have a higher prevalence of 42% and crude prevalence of 41.9%.(15) The overall prevalence of obesity in Jordan (body mass index, BMI ≥ 30 kg/m2) was 49.7%; 32.7% in males and 59.8% in females in a small community studies.(16)
The estimated overweight prevalence in a recent cross sectional survey in Jordan was 37.9% for males vs. 33.7% for females, the obesity rate was 14.4% and 23.4% for males and females respectively.(17)
We aimed to assess the demographic features of metabolic syndrome in a Jordanian cohort who fulfilled the criteria of NECP/ATPIII and the prevalence of composite cardiovascular disease; ischemic heart disease and stroke and predictor factors of ischemic heart disease and stroke.
Methods In a hospital based study; a total of 358 patients fulfilled the criteria of ATP III for metabolic syndrome.(5) Patients were recruited over one year (March 2005-2006) from out patient clinics and endocrine clinics, at King Hussein Medical Centre (KHMC), Prince Rashid Military Hospital and Prince Ali Military Hospital.
The anthropometric measures were taken at first clinical visit by measuring body weight to nearest kilogram and height, waist circumference and hip circumference to nearest centimeter. Blood was extracted after 12 hours of fast for Fasting Blood Sugar (FBS), Total Cholesterol (TC), Triglycerides (TG), and High Density Lipoprotein (HDL), Low Density Lipoprotein (LDL) and analyzed on same day by Hitachi 751 apparatus.
The cohort was divided into two groups according to gender and to the presence or absence of overt diabetes (metabolic syndrome in diabetes group) versus metabolic syndrome in non-diabetes group and compared among these groups. The whole group was also divided according to age groups (by 10 year interval) to compare the lipid profile, metabolic syndrome components, presence of complications, cardiovascular disease and diabetes mellitus.
The endpoints in the comparison group were the presence or absence of ischemic heart disease (IHD) and cerebrovascular accidents (CVA) or composite end point of both events (cardiovascular disease).
The APTIII components were studied for the whole groups and for gender groups to elicit predictors of IHD, CVA and composite cardiovascular disease.
Statistical analysis used descriptive analysis, t-student and chi-square tests for comparing measures and differences between two percentages. Univariate analysis using Epinfo 2006 was used for predictor evaluation. A p value of < 0.05 was considered as significant.
ResultsThere were 358 patients who fulfilled the criteria of metabolic syndrome according to ATPШ.(5) The mean age was 52.9 ±7.56 SD (range30-70) years.
There were 207 males (mean age 52.9± 7.5 years) and 151 females (mean age 52.6± 7.7 years), and 226 type II diabetic patients (already known diabetics on medical treatment) with a mean age of 53.6± 8.3 and 132 non-diabetic patients with a mean age of 49.2± 8.63(p=0.00013).
Waist circumference (WC)Fifty four percent of the whole cohort was having a WC ≥102cm. The mean WC was 104.1 ± 12.6 cm, no difference in the mean WC between males and females or between diabetic and non-diabetic groups (Table I, II).
Hypertension (HTN)Out of the whole group, 81.3% and 61.3% were having high systolic (SBP) and diastolic (DBP) blood pressure respectively. The mean SBP was 143.9± 15.5 and DBP was 88.7±10.0. No statistical differences between SBP and DBP between males and females (0.06, 0.053 respectively) was found (Table I), but diabetics were having a significantly higher DBP vs. non diabetics (89.7±11.1 Vs 87±9.5, p= 0.0009)
Fasting blood sugar (FBS) Seventy six percent of the cohort were having a FBS≥110 mg/dl; 47.7% of the non diabetic group and 92.9% of the diabetic group were having a FBS>110 mg/dl (p=0.000) with a significant difference in the FBS between the diabetic group vs. non diabetic (192.2 ±87.1 vs. 113.7±27.7, P=0.002) (Table I).
There was no significant difference between males and females regarding mean FBS (P=0.35) nor in overt diabetes between the two groups which was 63.7% for males and 62.2% in the females (P =0.2).
Lipid Profile Eighty five percent of the cohort had a serum triglyceride level (TG) >150 mg/dl and 50% were having a low HDL< 40 mg/dl. Females had the worst lipid profile compared to males.
The mean TG was higher (260.3±10.78mg/dl) for females than for males (237.1 ±112.2 mg/dl) (p=0.025), and females has lower HDL (37.5±79 mg/dl) compared to HDL in males (43.2±11.4 mg/dl) (p=0.001). The diabetics groups had higher TG and lower HDL vs. non diabetics; this however did not reach statistical significance (Table I, II)
Cardiovascular disease (CVD)The composite CVD (IHD and stroke) was significantly higher in diabetic group vs. the non-diabetic group. Composite CVD was 26.1% in the diabetic group vs. only 14.4% in non-diabetic group (P=0.0053).
Table I: Demographics and components of the metabolic syndrome and complications according to gender
|
P value
|
Females
n=151
|
Males
n=207
|
All
n=358
|
Mean
±SD
|
|
0.34
|
104.5±9.8
|
103.9±14.4
|
104.1±12.6
|
Waist
circumference
|
|
0.49
|
52.6±
7.7
|
52.9±
7.5
|
52.9 ±7.56
|
Age
|
|
0.06
|
142.4±14.5
|
145±16.2
|
143.9±15.5
|
Systolic
Blood Pressure
|
|
0.053
|
87.6±9.2
|
89.4±11.4
|
88.7±10.6
|
Diastolic
Blood Pressure
|
|
0.35
|
165.1±83.2
|
161.9±78.8
|
163.3±80.6
|
Fasting
Blood Glucose
|
|
0.025
|
260.3±107.8
|
237.1±112.3
|
246.8±110.9
|
Triglyceride*
|
|
<0.0001
|
37.5±7.9
|
43.2±11.4
|
40.8±10.5
|
High
Density Lipoprotein*
|
|
0.5
|
94(62.2%)
|
132(63.7%)
|
226(63.1%)
|
Diabetes
|
|
0.58
|
35(23.2%)
|
43(20.8%)
|
78(21.8%)
|
Cardiovascular disease
|
|
0.81
|
27(17.9%)
|
35(16.9%)
|
62(17.3%)
|
Ischemic
Heart Disease
|
|
0.51
|
8(5.3%)
|
8(3.9%)
|
16(4.5%)
|
Stroke
|
|
0.0014
|
3.9±0.76
|
4.1±0.77
|
4.05±0.77
|
Metabolic
Syndrome components*
|
* p value is significant
Table II: Components of the metabolic syndrome and complications according to presence or absence of overt diabetes
|
P value
|
Non-DM group n=132
|
DM group n=226
|
Mean
± SD
|
|
|
75:57
|
132:94
|
M:F
|
|
0.32
|
103.7±12.3
|
104.4±12.8
|
Waist
circumference
|
|
0.00013
|
49.2±8.64
|
53.6±8.3
|
age (yr )*
|
|
0.068
|
142.3±16
|
144.8±15.3
|
SBP
|
|
0.01
|
87±9.5
|
89.7±11.1
|
DBP*
|
|
<0.0009
|
113.6±28
|
192.5±87.5
|
FBS*
|
|
0.06
|
236.4±99.3
|
252.9±116.9
|
TG
|
|
0.26
|
41.3±10.5
|
40.5±10.5
|
HDL-C
|
|
0.02
|
19(14.4%)
|
59(26.1%)
|
Cardiovascular
disease*
|
|
0.019
|
13(9.8%)
|
49(21.7%)
|
IHD*
|
|
0.81
|
6(4.5%)
|
10(4.4%)
|
Stroke
|
|
<0.0001
|
3.72±0.69
|
4.25±0.76
|
No.
of MS components*
|
* p value is significant
Diabetics were having a significantly higher prevalence of IHD (21.7%) vs. non-diabetics (9.8%) (p=0.0023). There was no statistical difference however, in the prevalence of stroke between the two groups (4.4% vs. 4.5 %, p=0.48). There was also no difference between males vs. females in regard to composite CVD, IHD or stroke prevalence.
Number of Metabolic Syndrome ComponentsThe mean number of metabolic syndrome components was 4.05±0.77 for the whole cohort. Males were having more metabolic syndrome components than females (4.1±0.77 vs. 3.9±0.76, p=0.0014). Diabetics were also having more metabolic syndrome components than non diabetics, (4.25±0.76 vs. 3.72±0.69, p<0.001) (Table I, II). The number of metabolic syndrome components increased with increasing age when divided into decades for both diabetics and non diabetics groups.
The prevalence of DM, IHD, and stroke also showed an increase with increasing age, (Table III), and with increasing waist circumference (Fig. 1).
Predictors of composite CVD (IHD and Stroke) A univariate analysis showed that WC≥102cm, FBS>110mg/dl and high TG>150 mg were a strong predictors of IHD but not for stroke; however high level HDL was a negative predictor of composite CVD and IHD as there were more patients with IHD in the cohort with high HDL than for low HDL (Table IV).
The presence of diabetes per se was a strong predictor of composite CVD and IHD in a cohort with metabolic syndrome.
Discussion
The current study is the first study in a Jordanian cohort that assessed the components of metabolic syndrome and the prevalence of IHD and stroke in two cohorts with metabolic syndrome (diabetics and
Table III:Components of the Metabolic Syndrome and complications by decades of age
|
Mean no. of MS components
|
Stroke
n (%)
|
IHD
n (%)
|
DM
n (%)
|
Male: Female
|
Age
group years
|
|
3.8±0.83
|
0
|
0
|
4(44.4%)
|
5:4
|
31-40 n=9
|
|
3.9±0.74
|
0
|
3(5.9%)
|
23(45%)
|
29:22
|
41-50 n=51
|
|
4±0.76
|
6(3.5%)
|
24(13.9%)
|
107(62.2%)
|
101:71
|
51-60 n=172
|
|
4.2±0.8
|
10(7.2%)
|
35(28.2%)
|
92(73.4%)
|
72:54
|
>60 n=126
|
Table VI: Predictors of IHD, Stroke and CVD, in correlation with all metabolic syndrome components
|
Stroke
|
Ischemic Heart Disease
|
Composite Cardiovascular Disease
|
N
|
|
|
8(3.8%)
8(5.1%)
0.51
|
35(16.8%)
27(17.3%)
0.81
|
43(21.8%)
35(23.2%)
0.58
|
207
151
|
Gender
Male
Female
p
value =
|
|
7(4.2%)
9(4.7%)
0.81
|
23(13.8%)
39(20.4%)
0.09*
|
30(17.9%)
48(25.1%)
0.01*
|
167
191
|
Waist
circumference
≤102
cm
>102cm
p
value =
|
|
4(4.7%)
12(4.4%)
0.9
|
7(8.2%)
55(20.7%)
0.011*
|
11(12.9%)
67(24.5%)
0.02*
|
85
273
|
Fasting Glucose
≤110 mg/dl
>110 mg/dl
p value =
|
|
5(5.4%)
11(4.1%)
0.6
|
18(19.6%)
44(16.5%)
0.5
|
23(25%)
55(20.7%)
0.75
|
92
266
|
Systolic
blood pressure
<130
mmHg
≤130
mmHg
p
value =
|
|
6(4.4%)
10(4.5%)
0.67
|
21(15.4%)
41(18.5%)
0.42
|
27(19.8%)
51(23%)
0.48
|
136
222
|
Diastolic blood pressure
<85
mmHg
≤85
mmHg
p
value =
|
|
2(3.6%)
14(4.6
%)
0.54
|
14(25%)
48(15.9%)
0.09
|
16(28.6%)
62(20.5%)
0.018*
|
56
302
|
Triglyceride
≤150
mg/dl
>150
mg/dl
p
value =
|
|
10(4.9%)
6(3.8%)
0.6
|
23(11.4%)
39(25%)
0.0007*
|
33(16.3%)
45(28.8%)
0.004*
|
202
156
|
High
density lipoprotein
≤40
mg/dl
>40
mg/dl
p value=
|
* p value is significant
non-diabetics). The exact prevalence of Metabolic Syndrome in Jordan is not known and this study studied patients already known to fulfill the metabolic syndrome criteria.
Obesity in Jordan has been assessed by a cross sectional study performed by the Ministry of Health(16) and showed high prevalence of obesity mainly in females; although more females were having IHD and stroke than males this did not reach a statistical significance.(16,17)
This study revealed important issues; females had a worst lipid profile than males and were more obese (higher WC) than males.
The diabetic cohort was having a significantly higher numbers of metabolic syndrome components than the non-diabetic cohort for obvious causes (diabetes per se is a component of metabolic syndrome).
The diabetic cohort's mean SBP was higher than the mean SBP of non-diabetics but not reaching statistically significant difference (0.06). However the mean DBP was significantly higher in the diabetic group adding to the already known risk factors for CAD (Table II).
The lipid profile including LDL, HDL and TG was worst in diabetics contributing to the already known predisposition to IHD, and probably explaining the increased prevalence of composite CVD and IHD in the diabetic cohort vs. non diabetic one( p<0.002). There was no statistical difference in the stroke
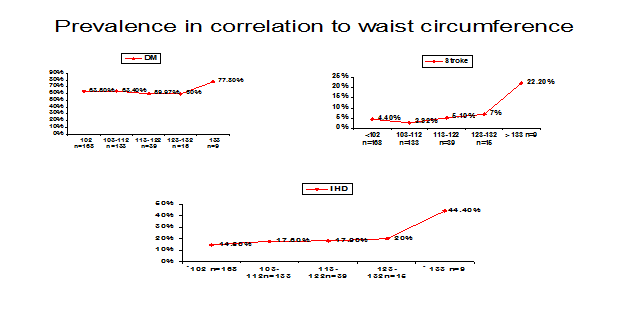 Fig. 1:
 Prevalence of DM, IHD and stroke in correlation to waist circumference
prevalence between males vs. females, neither between diabetics vs. non-diabetics because the numbers of patients was small and did not reach statistical significance, since patients with stroke are seen mainly by the neurologists and were not represented adequately in this study.
This study also looked into predictors of CVD, (IHD and stroke) and individually for each component and revealed that waist circumference >102cm and mainly above 132cm is strongly associated with IHD and stroke. FBS was another predictor of worst outcome.
The inverse relationship between high level of HDL and composite CVD and IHD was negated by multiple risk factors for CVD.(18) The other metabolic syndrome components off ATPIII were not found to have any predictor effect (Fig. 1)
Our results are comparable with local and international figures in regard to association of metabolic syndrome and CVD;(1,2,9) hyperlipidemia though is higher in our group.(7,11-15)
We conclude that diabetics with Metabolic Syndrome are having the worst CVD composite end point and females have the worse lipid profile in comparison to males. WC and FBS are the strongest predictors of IHD (and composite CVD). Further larger controlled studies are needed to reveal whether there is difference in the stroke prevalence.
References 1.
Vega GL. Obesity, the metabolic syndrome, and cardiovascular disease. Am Heart J 2001; 142:1108-1116
2.
Isomaa B, Almgren P, Tuomi T, et al. Cardiovascular Morbidity and Mortality Associated with the Metabolic Syndrome. Diabetes Care 2001; 24:683-689.
3.
Reaven GM. Role of insulin resistance in human disease. Diabetes 1988; 37:1595-1607.
4.
Alberti KG, Zimmet PZ. For the WHO Consultation: Definition, diagnosis and classification of diabetes mellitus and its complications. Part I: Diagnosis and classification of diabetes mellitus, provisional report of a WHO Consultation. Diabet Med 1998; 15:539-553.
5.
Expert Panel on Detection, Evaluation, and Treatment of High Blood Cholesterol in Adults. Executive Summary of the Third Report of the National Cholesterol Education Program (NCEP III) Expert Panel on Detection, Evaluation, and Treatment of High Blood Cholesterol in Adults (Adult Treatment Panel III). JAMA 2001; 285: 2486-2497.
6.
Ford GS, Giles WH, Dietz WH. Prevalence of the metabolic syndrome among US adults: findings from the Third National Health and Nutrition Examination Survey. JAMA 2002; 287:356-359.
7.
Cameron AJ, Shaw JE, Zimmet PZ. The metabolic syndrome: prevalence in worldwide populations. Endocrinol Metab Clin N Am 2004;33:351-355
8. Gogia Atul, Agarwal PK. Metabolic syndrome. Indian Journal of Medical Sciences 2006;60(2):72-81.
9.
Tillin T, Forouhi N, Johnston DG, et al. Metabolic syndrome and coronary heart disease in South Asians, African-Caribbean and white Europeans: A UK population-based cross-sectional study. Diabetologia 2005; 48(4):649-656
10.
Gang H, Qiao Q, Tuomilehto J, et al. Prevalence of the metabolic syndrome and its relation to all-cause and cardiovascular mortality in nondiabetic European men and women. Arch Intern Med 2004; 164(10):1066-1076.
11.
Harzallah F, Alberti H, Ben Khalifa F. The metabolic syndrome in an Arab population: a first look at the new International Diabetes Federation criteria. Diabet Med 2006; 23(4):441-4.
12.
Abdul-Ghani MA, Sabbah M, Muati B, et al. High frequency of pre-diabetes, undiagnosed diabetes and metabolic syndrome among overweight Arabs in Israel. Isr Med Assoc J 2005; 7(3):143-147.
13.
Jaber LA, Brown MB, Hammad A, et al. The prevalence of the metabolic syndrome among Arab Americans. Diabetes Care 2004; 27(1):234-238.
14.
Abdul-Rahim HF, Husseini A, Bjertness E, et al. The Metabolic Syndrome in the West Bank Population. Diabetes Care 2001; 24: 275–279
15.
Al-Nozha MM, Al-Khadra A, Arafah MR, et al. Metabolic syndrome in Saudi Arabia. Saudi Med J 2005; 26 (12): 1918-1925
16.
Ajlouni K, Jaddou H, Batieha A. Obesity in Jordan. Int J Obes Relat Metab Disord 1998; 22(7):624-628.
17.
Assessing risk factors for chronic disease-Jordan, 2004. Centers for Disease Control and Prevention (CDC). MMWR Morb Mortal Wkly Rep. 2006; 55(23):653-655
18.
Koren-Morag N, Goldbourt U, Tanne D. Relation between the metabolic syndrome and ischemic stroke or transient ischemic attack: a prospective cohort study in patients with atherosclerotic cardiovascular disease. Stroke 2005; 36(7):1366-1371.