ABSTRACT
Objectives: To estimate the frequency of osteoporosis as well as
the optimal cut-off points of osteoporosis fracture risk based on bone mineral density
T-score of lumbar spine and the total hip region for the women in North of
Jordan.
Methods: This is a hospital-based study which was conducted
among 394 women with frequent joints pain were seen in the out patient clinic
of the physical and medical rehabilitation clinic at Prince Rashid Bin
Al-Hassan Military Hospital, North of Jordan, between January and December
2009. Their age ranged from 32 to 80 years. Women with secondary osteoporosis were
excluded and patients with orthopedic complaints were included in this study.
The bone mineral density (gm/cm2) and T-score were obtained by dual-energy
X-ray absorptiometry for the lumbar spine and total hip region, performed in the
Department of Nuclear Medicine at King Hussein Medical Center-Amman/Jordan. We
used Statistical Package of Social Science to find the frequency based on WHO
definition, the T-score of less than or equal to -2.5 is defined as
osteoporosis, a T- score between -1 and -2.5 as osteopenia, and T-score of more
than -1 was considered as normal. The Pearson Correlation statistical method was
run between weight, height, Body Mass Index (weight divided by height meter
square) and bone mineral density T-score. Receiver Operating Characteristic
Curve analysis classified the 247 women without bone fractures and 147 with
bone fractures in order to set the arbitrarily rapid best T-score cut-off
values for prediction and screening of fracture risk regardless of the age and
race.
Results: The lumbar
spine bone mineral density T-score found 260 women (66.0%) to be classified as normal
with T-score of -0.7 to -0.4, 12.9% as osteopenic with T score -2.0 to -1.7 and
21.1% as osteoporosis with T-score -3.6 to -3.3. The total hip bone mineral
density T-score was analyzed, 71.8% were normal with T-score -0.6 to -0.3, 17.5%
osteopenic with T-score -2.0 to -1.7, and 10.7% as osteoporotic with a T-score
of -3.3 to -3.0. The frequency of osteoporosis
increased with increasing age, low weight, and short
height (P < 0.05) but did not
correlate with Body Mass Index. The lumbar spine bone mineral T-score ≤ -2.5
was found to be the optimum cut-off value in the prediction of fracture risk (sensitivity
91.2% and specificity 89.9%). The total hip bone mineral T-score ≤ -2.4 was
found to be the optimum cut-off value in the prediction of fracture risk (sensitivity
93.9% and specificity 90.3%).
Conclusions:
Early diagnosis of the disease and
initiate proper therapy for osteoporosis is available, but prevention is
definitely more cost-efficient
Key
words: Bone
Mineral Density T-score, Cut-off Value, Fracture Risk Hip, Osteoporosis,
Osteopenia, Lumbar.
JRMS
December 2011; 18(1): 20-26
Introduction
Osteoporosis is the most common worldwide-generalized
disease of the skeleton.(1) It is one of the most common
metabolic bone diseases, which is characterized by progressive loss of bone
density and thinning of bone tissue, enhanced bone fragility and an increase
fracture risk.(2-4) Postmenopausal
osteoporosis is a major public health problem and estrogen deficiency is a key
factor in the pathogenesis of postmenopausal osteoporosis.(5-10)
The Bone mineral density (BMD) measurements obtained by
dual energy X-ray absoptiometry (DEXA) for lumber spine and hip region is
widely regarded as the most important non-invasive determinant of bone
fragility, strength, and fracture risk.(1) According to the
World Heath Organization (WHO)
definition, the T-score of -1 to -2.5 is defined as osteopenia and that
less than or equal to -2.5 is defined as Osteoporosis.(1,5,11,12)
Osteoporosis increases in prevalence with age and is
very common in elderly women.(13) With aging, the process of
coupled bone formation is affected by the reduction of osteoblast
differentiation, activity, and life span, which is further, potentiated in the
perimenopausal years with hormone deprivation and increased osteoclast activity.(14,15)
Age-related bone loss is thus not only a consequence of hormone deprivation,
but also the result of changes in bone formation and cell-cell interactions
with a unique pathophysiology. In this review, we describe the cellular and
metabolic changes associated with aging bone and present recent evidence
regarding cell differentiation within the bone marrow. We also consider the
mechanism of programmed cell death, apoptosis, as being an important
determinant of aging in bone as well as describe possible future interventions
to prolong the life span of osteoblasts.(14)
The high prevalence of osteoporosis observed in
diabetic patients could be attributed to association of multiple variables on
top of diabetes and menopause such as vitamin D deficiency, lack of sun
exposure and lack of intake of milk and dairy products, lack of exercise and
probably genetic.(15-20)
Parathyroid hormone is anabolic in bone, but when
secreted in excess it is catabolic.(21) Its levels increase
with age in both genders, paralleling the incidence of osteopenia and osteoporosis.(21,22)
It is well established that
hyperparathyroidism is responsible for changes in bone metabolism leading to a
reduction in bone mineral density,(17,23) and the National
Osteoporosis Foundation lists hyperparathyroidism as a risk factor for
osteoporosis.(4,22)
The aim of this study is to estimate the frequency of
osteoporosis as well as the optimal cut-off points of osteoporosis fracture
risk based on DEXA bone mineral density T-score of lumbar spine and the total
hip region for the women in North of Jordan.
Methods
This is a hospital-based study which was conducted
among 394 women with frequent joints pain were seen in the out patient clinic
of the physical and medical rehabilitation at Prince Rashid Bin Al-Hassan Military
Hospital, North of Jordan, between January and December 2009. Their age ranged from
32 to 80 years (mean age +/- SD; 51.6 ± 14.1 years). The local ethical
committee of the Royal Medical Services approved this study. Women with
secondary osteoporosis were excluded from the study. Patients with orthopedic
complaints were included in this study. The bone mineral density (gm/cm2)
and T-score measurements, that obtained by Dual-Energy X-ray Absorptiometry
(DEXA) lumbar spine (L1-4) and total hip region, which was performed in the Department
of Nuclear Medicine at King Hussein Medical Center-Amman/Jordan. Based on WHO
definition, osteoporosis classified as a T-score of <-2.5, osteopenia as a
T- score between -1 and -2.5 and T-score > -1 was considered as normal. The
data of women’s age, weight, height, body mass index (weight divided by height
meter square) and DEXA results “bone mineral density T-score for lumbar spine
and total hip region” were transferred to Statistical Package of Social Science
(SPSS) software. Regardless of the age and race, the lumbar spine and total hip
region T-scores were classified into two groups of women (247 women without
bone fractures and 147 with bone fractures group), by using Receiver Operating
Characteristic Curve analysis (ROC) in order to set the arbitrarily rapid best
T-score cut-off values with the highest sensitivity and specificity. In
addition, their 95% confidence interval (CI) for screening and detection of
bone fractures.
Results
In Table I, the recorded variables for 394 women
included in this study as of the follow: age [51.6 ± 14.1, 95% CI;
50.2 to 53.0
years], weight [70.3 ±17.9,
95% CI; 68.5 to 72.1 kg], height [150.4 ± 6.4,95%
CI; 159.7 to 170.0 cm], BMI [27.3 ± 6.6, 95% CI; 26.6 to 27.9], lumbar spine
bone mineral density (BMD) [0.759 ± 0.25, 95% CI; 0.734 to 0.784 gm/cm2],
lumber spine T-score [-1.3 ± 1.64, 95% CI; -1.5 to -1.8], total hip region BMD
[0.818 ± 0.20, 95% CI; 0.798 to 0.837 gm/cm2], and total hip region
T-score [-0.982 ± 1.25, 95% CI; -1.1 to -0.9].
In Table II, the DEXA results for the lumbar spine BMD
and T-score, referenced to WHO criteria of the correspondent age and race.
12.9% of women had osteopenia [BMD = 0.673 ± 0.13 gm/cm2, 95% CI; 0.636 to 0.710 gm/cm2,
T-score; -1.8 ± 0.56] and 21.1% had osteoporosis [BMD = 0.518 ± 0.11 gm/cm2,
95% CI; 0.494 to 0.542 gm/cm2,
T-score; -3.5 ± 0.67].
In Table III, the DEXA results for the total hip BMD
and T-score, referenced to WHO criteria of the correspondent age and race.
17.5% of women had osteopenia [BMD = 0.711 ± 0.09 gm/cm2, 95% CI; 0.690 to 0.732 gm/cm2,
T-score; -1.8 ± 0.52] and 10.7% had osteoporosis [BMD = 0.543 ± 0.07 gm/cm2,
95% CI; 0.520 to 0.566 gm/cm2,
T-score; -3.2 ± 0.45].
As shown in Table IV, the age specific frequency of
osteoporosis was higher in the older age women. Below the age of 50 years, the
frequency of osteoporosis in the results of DEXA for lumber spine and hip were
6.1% and 2.8% respectively. Between ages
50-65 year, the age specific frequencies were 7.4% and 3.8%. Above the age of
65 years, the age specific frequencies were 7.6% and 4.1% respectively. The
spine-to-hip osteoporosis ratio was 2:1 (21.1/10.7).
In table V and VI for both DEXA of lumbar spine and
total hip BMD T-score classifications, the weight and height in this study were
negatively associated with the presence of osteoporosis (osteoporosis was more
likely increased with low weight and short height), on other hand BMI did not
correlate with the presence of osteoporosis.
In Table VII, a DEXA lumbar spine T-score in women
with bone fractures (-2.6 ± 1.3) was significantly higher than in women without
bone fractures group (-0.6 ± 1.3) (P-value < 0.001). On other hand a DEXA of
total hip T-score was also significantly higher in women with bone fractures
(-1.8 ± 1.2) (P-value < 0.001).
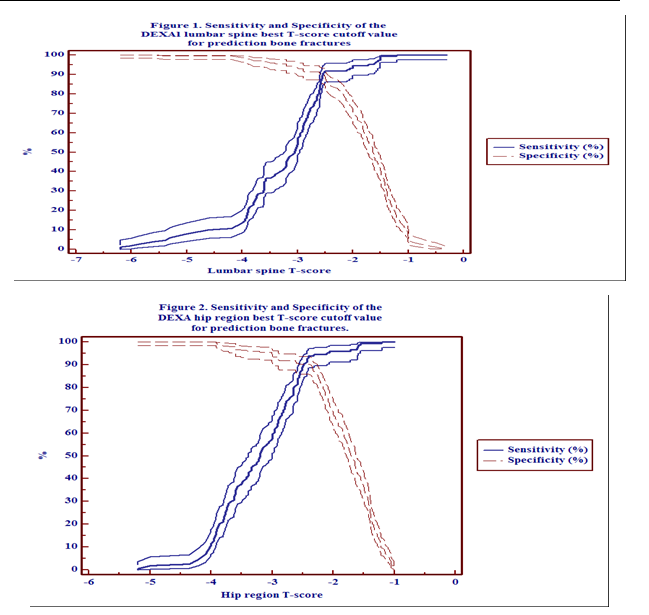
In Table VIII, Figure 1 and Figure 2, the DEXA lumber
spine best T-score cut-off value for prediction bone fractures was ≤ -2.5, with
sensitivity 91.2% (95% CI; 85.3-95.2%) and
specificity 89.9% (95%
CI;
85.4-93.3%). On other hand for the total hip region the findings were somewhat
similar to lumbar spine, the best
T-score cut-off value was ≤ -2.4,
sensitivity 93.9% (95% CI; 88.7-97.2%) and specificity 90.3% (95% CI;
85.9-93.7%).
Discussion
To the best of our knowledge, this is the first
independent hospital-based study concerning the frequency of osteoporosis and
fracture risk among women in the North of Jordan.
Using a T-score threshold of -2.5 (WHO), the
frequency of osteopenia and osteoporosis in North of Jordan was 12.9% and 21.1%,
for DEXA measures of the lumbar spine. Moreover, it was 17.5 and 10.7% for DEXA
measures of total hip, respectively. At the other scale, the spine-to-hip
osteoporosis frequency ratio was 2:1. This is somewhat consistent with a study
among middle age Jordanian women attending the Orthopedics and Rheumatology out
patient clinics at the Major Teaching Hospital in Amman, Jordan,
that found 13% were found to be osteoporotic, 40% osteopenic and 46% had normal
bone density in the lumbar spine. In the hip, only 1% of the women were
diagnosed with osteoporosis, 26% with osteopenia and 72% with normal bone
density.(12) In other community- base study among Jordanian
women, 29.6% were identified as having osteoporosis, 43.8% were osteopenic.(10)
A study in Saudi Arabia reported that the prevalence of osteopenia and
osteoporosis in postmenopausal women were 30.6% and 39.5%, respectively.(5)
Other study among Turkish women, aged 40-90 years, reported that the prevalence
of osteoporosis for women was 30% and 22% for DEXA measurements of the lumbar
spine and hip, respectively.(8) Wainwright et al explained
the higher frequencies of lumbar spine osteoporosis and reported that the
prevalent vertebral fracture, and lower total hip BMD, associated with increased
fracture risk in women without hip osteoporosis. Together, these findings
highlight the complex etiology of hip fracture and help begin to identify risk
factors associated with higher bone density levels.(24)
Table
I. The study group mean +/- SD and 95%
CI of age, weight, height, BMI, lumber spine BMD, T-score, total hip BMD and
T-score
|
Variable
|
Mean ± SD
|
95% CI
|
|
Age/years
|
51.6 ± 14.1
|
50.2 - 53.0
|
|
Weight/kg
|
70.3 ± 17.9
|
68.5 - 72.1
|
|
Height/cm
|
150.4 ± 6.3
|
159.7 - 170.0
|
|
BMI
|
27.3 ± 6.6
|
26.6 - 27.9
|
|
lumber spine BMD gm/cm2
|
0.759 ± 0.25
|
0.734 - 0.784
|
|
lumber
spine T-score
|
-1.3 ± 1.64
|
-1.5 to -1.8
|
|
Total
hip BMD gm/cm2
|
0.818 ± 0.20
|
0.798 - 0.837
|
|
Total
hip T-score
|
-0.982 ± 1.25
|
-1.1 to -0.9
|
Table
II. Frequency of osteopenia and
osteoporosis based on WHO classification, that is concordant with DEXA results
of lumbar spine BMD and T-score
|
|
N (%)
|
BMD gm/cm2
Mean ± SD (95% CI)
|
T-score
Mean ± SD (95% CI)
|
|
Normal
|
260 (66.0)
|
0.853 ± 0.24 (0.824 - 0.882)
|
-0.6 ± 1.33 (-0.7 to -0.4)
|
|
Osteopenia
|
51 (12.9)
|
0.673 ± 0.13 (0.636 - 0.710)
|
-1.8 ± 0.56 (-2.0 to -1.7)
|
|
Osteoporosis
|
83 (21.1)
|
0.518 ± 0.11 (0.494- 0.542)
|
-3.5 ± 0.67 (-3.6 to -3.3)
|
Table
III. Frequency of osteopenia and
osteoporosis based on WHO classification, that is concordant with DEXA results
of total hip BMD and T-score
|
|
N (%)
|
BMD gm/cm2
Mean ± SD (95% CI)
|
T-score
Mean ± SD (95% CI)
|
|
Normal
|
283 (71.8)
|
0.884 ± 0.19 (0.863 - 0.906)
|
-0.5 ± 0.96 (-0.6 to -0.3)
|
|
Osteopenia
|
69 (17.5)
|
0.711 ± 0.09 (0.690 - 0.732)
|
-1.8 ± 0.52 (-2.0 to -1.7)
|
|
Osteoporosis
|
42 (10.7)
|
0.543 ± 0.07 (0.520 - 0.566)
|
-3.2 ± 0.45 (-3.3 to -3.0)
|
Table
IV. Frequencies of osteopenia and
osteoporosis of DEXA results: for lumbar spine and total hip according to age
group
|
|
Lumber spine
|
Total hip region
|
|
|
Normal
|
Osteopenia
|
Osteoporosis
|
Normal
|
Osteopenia
|
Osteoporosis
|
|
Age
< 50 years
N
(%)
|
210
(53.3)
|
24
(6.1)
|
24
(6.1)
|
218
(55.3)
|
29
(7.4)
|
11
(2.8)
|
|
Age
50-65 years
N
(%)
|
33
(8.4)
|
18
(4.6)
|
29
(7.4)
|
40
(10.2)
|
25
(6.3)
|
15
(3.8)
|
|
Age
> 65 years
N
(%)
|
17
(4.3)
|
9
(2.3)
|
30
(7.6)
|
25
(6.3)
|
15
(3.8)
|
16
(4.1)
|
|
Total
N
(%)
|
260
(66.0)
|
51
(12.9)
|
83
(21.1)
|
283
(71.8)
|
69
(17.5)
|
42
(10.7)
|
Table
V. The weight, height and BMI in
correlation with osteoporosis based on DEXA of the lumbar spine BMD T-score
|
|
Weight
mean ± SD kg
|
Height
mean ± SD cm
|
BMI
mean ± SD
|
|
Normal
|
71.6 ± 18.9
|
161.9 ± 6.0
|
27.3 ± 7.0
|
|
Osteopenia
|
70.1 ± 13.9
|
158.9 ± 5.3
|
27.7 ± 5.2
|
|
Osteoporosis
|
66.4 ± 16.7
|
156.4 ± 5.9
|
25.9 ± 6.1
|
|
Average
+/- SD of all groups
|
70.3 ± 17.9
|
160.3 ± 6.3
|
27.3 ± 6.6
|
|
Pearson
Correlation (r)
P-value
|
-0.114
0.024
|
-0.354
< 0.001
|
-0.015
0.756
|
Table
VI. The weight, height and BMI in
correlation with osteoporosis based on DEXA of the total hip BMD T-score
|
|
Weight
mean ± SD kg
|
Height
mean ± SD cm
|
BMI
mean ± SD
|
|
Normal
|
71.8 ± 18.4
|
161.7 ± 5.9
|
27.4 ± 6.8
|
|
Osteopenia
|
69.5 ± 14.2
|
158.6 ± 4.6
|
27.6 ± 5.4
|
|
Osteoporosis
|
61.4 ± 17.7
|
153.8 ± 6.3
|
25.8 ± 6.7
|
|
Average
+/- SD of all groups
|
70.3 ± 17.9
|
160.3 ± 6.3
|
27.3 ± 6.6
|
|
Pearson
Correlation (r)
P-value
|
-0.169
0.001
|
-0.404
< 0.001
|
-0.061
0.224
|
Table
VII. The DEXA lumbar spine and total
hip T-scores difference between women without and with bone fracture groups
|
|
Without fractures group
N = 247
|
With fractures group
N = 147
|
P-value
|
|
Lumbar
spine T-score
mean
± SD
|
-0.6 ± 1.3
|
-2.6 ± 1.3
|
< 0.001
|
|
Total
hip region
mean
± SD
|
-0.5 ± 0.9
|
-1.8 ± 1.2
|
< 0.001
|
Table
VIII. The best DEXA results cut-off
values T-score of lumbar spine and total hip for prediction bone fractures
|
|
Cut-off value
|
Sensitivity %
|
95% CI
|
Specificity %
|
95% CI
|
|
Lumbar
spine T-score
|
≤ - 2.5
|
91.2
|
85.3-95.2
|
89.9
|
85.4-93.3
|
|
Total
hip region T-score
|
≤ - 2.4
|
93.9
|
88.7-97.2
|
90.3
|
85.9-93.7
|
In this study when the women were divided into age groups, the age specific rate of osteoporosis increased with age. The lumbar spine BMD T-scores indicated 6.1% of the less than 50-year age group was
osteoporotic, 7.4% of the 50-65 year age group and increasing to 7.6%
of the women age
group more than 65 year. The total hip
BMD T-scores indicated 2.8% of the age group less than 50 year was
osteoporotic, 3.8% of the 50-65 year age group and increasing to 4.1% of the
women age group more than 65 year. Women’s lumbar spine and total hip BMDs were
grouped according to the T-score and then comparisons made between the three
groups of women (osteoporotic, osteopenic and normal). In a study conducted in UK by
Patel et al demonstrated that both osteoporosis and fall-related risk
factors become more common with increasing age.(25) Changes in bone turnover begin already in
late premenopause in which bone formation may precede increased bone resorption
induced by estrogen withdrawal. These changes remain largely unchanged in early
menopause. They suggested an increased rate of bone turnover and remodeling in
osteoporotic elderly women.(5,6,19-20)
People with a BMI of 21 or less have a higher rate of
bone loss than those who are heavier, and obese people have lower rates of bone
loss than those who are ideal weight(26) and our study found
that, osteoporosis more likely increase in thin and short women, while BMI does
not have a correlation with osteoporosis. These results were in agreement with
Sordia et al in Mexico
and Martini et al in Brazil,
the postmenopausal women with low weight and short height, rather than patients
with low BMI correlates in a better way with the diagnosis of osteoporosis. They
recommend performing a bone mineral density
study in this group of patients.(27,28)
Osteoporosis is often referred to as a "silent
disease" because bone loss occurs without any symptoms. In fact, many
people do not know that they have osteoporosis until they get an osteoporotic
fracture. Thus, it is safe to say that osteoporosis is an under recognized and
under treated disease. And while osteoporosis is a debilitating disease,
medical experts agree that osteoporosis is a highly preventable and treatable,
so that in this study, the high sensitive and specific T-score cut-off value
for roughly screening fracture risk regardless of the age category by the DEXA
lumber spine and total hip was about ≤ -2.5. This somewhat consistent with a
study conducted in Iran used ROC curves, a T-score = -2.1 SD was found the
optimum cut-off point of the dual x ray and laser technique in the diagnosis of
osteoporosis in the lumbar spine, sensitivity and specificity were 82% and 79%
respectively. The optimal cut-off point of the dual X ray and laser technique
in the diagnosis of osteoporosis in the neck region of the femur was a T-score
of -2.6 SD (sensitivity and specificity were 85 and 86%).(29)
These results were in agreement with the
WHO definition, the T-score of less than or equal to -2.5 is defined as
osteoporosis.(1,5,30) The
value of DEXA at this cut-off value in establishing the diagnosis of
osteoporosis would eventually result in reduced bone strength and increased
propensity to fractures.(1,30,31)
Limitation of the Study
The restricted sampling of women with frequent joints
pain holding a military health insurance and who attended the physical and
medical rehabilitation clinic at the Prince
Rashid Bin
Al-Hassan Military
Hospital, North of Jordan
where the study was conducted and therefore may not represent the whole
population. Moreover, we did not study the socio-economic, demographic
variables, nutritional, bio-chemical markers, hormonal markers and racial
differences attributed to underlying cause of osteoporosis. Furthermore, no
investigations were made regarding reports of previous fractures and family
histories of fractures, which are risk factors frequently associated with
osteoporosis and fractures.
Conclusion
Our results indicate that osteoporosis reported to be
common among postmenopausal older age, short stature and low weight women in
North of Jordan. In addition, the bone mineral density T-score < -2.5 seems
to strongly suggest the likelihood of fracture risk. However, early diagnosis
of the disease and initiate proper therapy for osteoporosis is available, but
prevention is definitely more cost-efficient.
References
1.Humadi A, Alhadithi RH, Alkudiari
SI. Validity of the DEXA diagnosis of involutional
osteoporosis in patients with femoral neck fractures. Indian J Orthop
2010; 44(1):73-78.
2.Cummings SR, Bates D, Black DM. Clinical
use of bone densitometry: scientific review. JAMA 2002; 288(15):1889-97.
3.Maalouf G, Gannage-Yared MH, Ezzedine J, et al. Middle East and North Africa consensus on osteoporosis.
J Musculoskelet Neuronal Interact 2007; 7(2):131-143.
4.Baum E, Peters KM. The
diagnosis and treatment of primary osteoporosis according to current
guidelines. Dtsch Arztebl Int 2008; 105(33):573-582.
5.El-Desouki MI. Osteoporosis in postmenopausal Saudi women using dual
x-ray bone densitometry. Saudi Med J 2003; 24(9): 953-956.
6.Siris ES, Miller PD, Barrett-Connor E, et al. Identification and fracture outcomes of undiagnosed low bone mineral
density in postmenopausal women: results from the
National Osteoporosis Risk Assessment. JAMA 2001; 286(22): 2815-2822.
7.Buencamino MC, Palomo L, Thacker HL. How menopause affects oral health, and what we can do about it. Cleve
Clin J Med 2009; 76(8): 467-475.
8.Kayalar G, Cevikol A, Yavuzer G, et al. The value of calcaneal bone mass measurement using a
dual X-ray laser Calscan device in risk screening for osteoporosis. Clinics
(Sao Paulo)
2009; 64(8):757-62.
9.Baber RJ, O'Hara JL, Boyle
FM. Hormone replacement therapy: to use or not to
use? Med J 2003; 178(12): 630-633.
10.Shilbayeh S. Prevalence of osteoporosis and its reproductive risk
factors among Jordanian women: a cross-sectional study. Osteoporos Int
2003; 14(11): 929-940.
11.Harrington JT, Lease J. Osteoporosis disease management for fragility
fracture patients: new understandings based on three years' experience with an
osteoporosis care service. Arthritis Rheum 2007; 57(8):1502-6.
12.Al-Qutob RJ, Mawajdeh SM,
Khalil AA, et al. The
magnitude of osteoporosis in middle aged women. Saudi Med J 2001; 22(12):1109-1117.
13. Greenspan SL, Schneider DL,
McClung MR, et al. Alendronate
improves bone mineral density in elderly women with osteoporosis residing in
long-term care facilities. A randomized, double-blind, placebo-controlled
trial. Ann Intern Med 2002; 136(10): 742-746.
14. Chan GK, Duque G. Age-related bone loss: old bone, new facts. Gerontology
2002; 48(2): 62-71.
15. Al Khawajah, FF. Osteoporosis. East Mediterr
Health J 2002; 8 (2-3): 440-443.
16. Al-Maatouq MA, El-Desouki MI,
Othman SA, et al. Prevalence of
osteoporosis among postmenopausal females with diabetes. Saudi Med J
2004; 25 (10): 1423-1427.
17. Haddad FH, Malkawi OM,
Sharbaji AA, et al. Primary
hyperthyroidism. Saudi Med J 2007; 28(5):783-787.
18. Saadi HF, Reed RL, Carter AO, et
al. Bone density estimates and
risk factors for osteoporosis in young women. East
Mediterr Health J 2001; 7 (4-5): 730-737.
19. Shehata OZ, Al-Toukhy MAH,
Abul Magd YS. Biochemical markers of
bone turnover in postmenopausal osteoporosis and relation to female sex hormone
estradiol. Egypt.
Rheumatol Rehabil 2003; 30 (2): 145-164.
20. Mustafa, NM, Monazama AF,
Mustafa KM, et al. Bone
turnover markers in relation to menopause in rhematoid arthritis patients. Egypt. Rheumatol
Rehabil 2003; 30 (3): 381-399.
21.Silver J, Bushinsky D. Harnessing the parathyroids to create stronger bones.
Curr Opin Nephrol Hypertens 2004; 13(4):471-476.
22.Braverman
ER, Chen TJ, Chen AL, et al. Age-related
increases in parathyroid hormone may be antecedent to both osteoporosis and
dementia. BMC Endocr Disord 2009; 9:21.
23.Mazzaglia
PJ, Berber E, Kovach A, et al. The
changing presentation of hyperparathyroidism over 3 decades. Arch Surg 2008;143(3):260-266.
24.Wainwright
SA, Marshall LM, Ensrud KE, et al. Study of osteoporotic fractures research group. Hip fracture in women
without osteoporosis. J Clin Endocrinol Metab 2005; 90(5): 2787-2793.
25.Patel S, Tweed K, Chinappen U. Fall-related risk factors and osteoporosis in older women referred to
an open access bone densitometry service. Age Ageing 2005; 34(1):67-71.
26.Zhao LJ, Liu YJ, Liu PY, et
al. Relationship of obesity with
osteoporosis. J Clin Endocrinol Metab 2007; 92(5):1640-1646.
27. Sordia
LH, Vazquez J, Iglesias JL, et al. Low height and low weight correlates better with osteoporosis than low
body mass index in postmenopausal women, International Congress Series
2004;1271: 407-410.
28. Martini
LA, de Moura EC, dos Santos LC, et al. Prevalence of self-reported diagnosis of osteoporosis in Brazil, 2006. Rev
Saude Publica 2009; 43(2):107-116.
29. Salimzadeh A, Forough B, Olia
B, et al. The cut-off point of
dual energy X- ray and laser (DXL) of calcaneus osteoporosis diagnosis in
postmenopausal women. Iran J Radiat Res 2005; 3 (2): 69-72.
30.El
Maghraoui A, Mouinga Abayi DA, Rkain H, et al. Discordance in diagnosis of osteoporosis using spine and hip bone
densitometry. J Clin Densitom 2007; 10(2):153-156.
31.Richy F, Gourlay M, Ross PD, et
al. Validation and comparative
evaluation of the osteoporosis self-assessment tool (OST) in a Caucasian population
from Belgium. QJM 2004; 97(1):39-46.