Abstract
Objective: To investigate the effect of 9 cheeses with different
compositions on the extent of demineralisation/ remineralisation of enamel
slabs in situ.
Methods: Sucrose and sorbitol solutions were used
as controls. Ten subjects were required to wear removable appliances with human
enamel slabs cut from white spot lesions created in vitro. The
subjects were required to wear their appliances, for two days to allow plaque
to grow. Over the following 5 days, they were asked to immerse their appliances
4 times per day for 10 minutes each time in a suspension of the test cheese or
control solution. De- or remineralisation was then measured using a combination
of microradiography and an image analysis system.
Results: The results for
lesion depth (µm) tested by paired t-test revealed significant net
remineralisation (p<0.05) with two types of cheeses. As for mineral loss or
gain (vol.%µm), significant net remineralisation was seen with 6 types of cheeses.
Conclusion: Some cheeses can cause remineralisation of
early lesions.
Key words: Cheese, Intra-oral cariogenicity test, Microradiography
JRMS March 2013; 20(1): 53-60
Introduction
The importance of diet in the production of dental caries has long been
acknowledged.(1) Despite improved trends in levels of dental
caries in developed countries, dental caries remains prevalent and is
increasing in some developing countries undergoing nutrition transition.(2) Findings from experimental animal studies and human investigations
suggest that several varieties of cheese do not contribute to dental caries and
that they may even help reduce the risk of caries.(3) Components of cheese such as protein (e.g., casein, bioactive peptides).(4) fat, calcium,
and phosphorus may contribute to this food’s caries protective effect. The potential mechanisms by which cheese may
play a protective role in dental caries include its ability to stimulate saliva
flow, inhibit plaque bacteria, and provide calcium and inorganic phosphate,
which reduce demineralization and enhance remineralization of tooth enamel.(5,6) While evidence to date suggests a protective effect of cheese against
dental caries, the active chemical or physical characteristics of cheese, which
are involved in this relationship, are not fully understood.
Toumba and Curzon investigated the potential cariogenicity of seven New Zealand
cheeses using the plaque sampling method.
Table
I: Cheese Compositions
|
Cheese
|
Moisture
%
|
Fat
%
|
Salt
%
|
pH
|
Calcium
mg/100g
|
Protein
%
|
CPP *
%
|
|
Control 1
(cheese 1)
|
46.4
|
26.5
|
1.9
|
5.7
|
550
|
19.7
|
-
|
|
Cook 1 Ca
1200mg/100gA
(cheese 2)
|
43.5
|
26.5
|
2.0
|
5.7
|
1430
|
19.8
|
-
|
|
Cook 2 Ca
1800mg/100gA
(cheese 3)
|
40.9
|
26.5
|
1.9
|
5.7
|
2140
|
20.1
|
-
|
|
Cook 3 Ca
1200mg/100gT
(cheese 4)
|
43.7
|
27.0
|
2.0
|
5.7
|
1420
|
19.8
|
-
|
|
Cook 4 Ca
1800mg/100gT
(cheese 5)
|
42.5
|
27.0
|
1.9
|
5.6
|
2060
|
19.9
|
-
|
|
Cook 1 CP
2% HCP101
(cheese 6)
|
51.2
|
25.0
|
2.1
|
6.1
|
250
|
19.8
|
0.4
|
|
Cook 2 CP
2% HCPIV
(cheese 7)
|
48.8
|
25.5
|
2.7
|
5.4
|
390
|
19.5
|
1.4
|
|
Cook 3 CP
5% HCPIV
(cheese 8)
|
50.2
|
29.5
|
3.5
|
5.0
|
200
|
19.0
|
2.4
|
|
Cook 1 CP
2% HCP101
(cheese 9)
|
48.4
|
27.5
|
1.9
|
5.7
|
536
|
18.4
|
1.2
|
The tested cheeses were all shown to have low acidogenic and cariogenic potential.(7) However,
it was not possible to say that cheeses caused remineralisation. So the authors
recommended further research in enamel demineralisation and remineralisation
testing to establish the mineral loss or gain with the cheese.
The aim of this study was to investigate the effect of
nine New Zealand
cheeses with different compositional components on the extent of
demineralisation/remineralisation of enamel slabs as determined using the intra-oral cariogenicity test (ICT).
Methods
This study was conducted at Leeds Dental
Institute / UK
during the year 2001. This ICT study design was that of Koulourides et al.(8) and later
modified by Pollard.(9)
The study involved subjects using various
cheeses in a double-blind randomised 11-leg cross-over design study. Nine New Zealand cheese products with
different compositions, and 10% sucrose and 10% sorbitol controls were tested.
The exact compositions of cheeses are shown in Table I.
Subject Selection
Following approval by the Research Ethics
Committee, at Leeds General Infirmary, 10 healthy dentate subjects participated
in the study after giving their informed consent. The volunteers comprised of 9
females and one male with a mean age of 35.1 years ± 8.09, mean DMFS of 22.8 ±13.37,
and mean salivary flow rate of 1.55 ml/minute ±0.69.
Subjects were healthy, not taking any
medications and with no active periodontal disease. A DMFS score ≥ 12 was
required and a minimum unstimulated salivary flow rate of 0.25 ml/min to
participate in the study.
Enamel Slab Preparation
Human premolar teeth, which were extracted
for orthodontic purposes, were collected and stored in distilled water and thymol
(Sigma Aldrich, Thymol 98%). Suitable teeth were selected and lightly
abraded with pumice and
fine wet and dry abrasive
paper (English
Abrasives P320A) to remove the outermost
enamel and any remnants
of pellicle from the
buccal surface.
The teeth were then painted with two coats
of an acid resistance coloured nail varnish (Max Factor® “Diamond Hard”),
except for a window of exposed enamel measuring approximately 6mm x 2mm in a
mesial distal orientation on the buccal surface. The apical end of each tooth
was covered in inlay wax and attached to a suitable length of solid glass rod
to hold the tooth in the demineralising gel. The rod was secured to the lid of
a “Sterilin” type universal tube so that when the top was screwed onto the
tube, the tooth was suspended in the centre of the tube’s free space.
The acidified gel that was used for the
creation of the artificial white spot lesions was based on that described by
Edgar.(10) The gel was then poured into the tubes in which
the mounted teeth were submerged. The teeth were left in the gel for four to
seven days until a white spot was clearly visible.
On removal from the gel, the teeth were
washed thoroughly in de-ionised water, and the varnish carefully removed with
acetone (GPR, BDH, Poole, England). Once cleaned the teeth
were air dried and mounted in “greenstick” impression compound (Kerr) on plates
that fitted into the cutting machine, a “Well” diamond wire saw (Well® Walter
EBNER, CH-2400 Le Loche). Each tooth was carefully sectioned to give the white
spot lesion measuring 6 mm length x 2mm width x 1.5 mm thickness. This was then further divided to give three
equal sized enamel portions of approximately 2mm x 2mm x 1.5mm. Two were used
as “test slabs” that were mounted within the in situ appliances while the third was retained to serve as the
control.
The enamel slabs were stored damp in sealed
containers and exposed to gamma radiation for sterilisation (4080 Gy) in the
Department of Chemistry of the University
of Leeds.
Experimental Protocol
A mandibular removable Hawley appliance with a labial arch wire and U
clasps and acrylic flanges buccally to the first permanent molars were made for
each volunteer. The enamel slab with an artificial white spot lesion was
randomly assigned to the left side of the appliance, where a well was made in
the buccal surface of the acrylic flange.
The selected enamel slab was secured in its
position with sticky wax, care being taken to ensure that the wax did not cover
the exposed surface of the enamel. The
slab was then covered by 0.15 mm Dacron gauze (Meadox Medicals, Oakland, NJ,
USA) to
promote plaque accumulation. The enamel slab was placed so that its surface was
level with that of the acrylic.(9)
The subjects were asked to wear their appliances continuously (except for
eating and drinking) for two days to allow plaque to grow. Over the following 5
days, they were asked to immerse their appliance 4 times per day for 10 minutes
each time in a suspension of the test food or control solution.
For the cheese samples this was achieved by having the subjects chew 10
gm portions of the test cheeses for one minute to obtain cheese/saliva slurry.
This slurry was used to cover the enamel slabs for the 10 minutes immersion
periods. After the 10 minutes immersion periods, the appliances were removed,
rinsed with water, and replaced in the mouth. This procedure was repeated four
times during the day.
The subjects were assigned randomly to either one of the test groups or
to the control groups according to a Latin square table. The volunteers had a
washout period of at least seven days between each test cheese and the control
solutions, to prevent any carry-over effect.
Specimen Preparation and Microradiography
Processing of
the Lesion
After the intra-oral periods, the enamel slabs were removed from the
appliances and mounted in “green stick” impression compound (Kerr) onto stubs.
The enamel slabs were sectioned using the diamond wire saw, which was described
earlier, to give specimens with thickness of approximately 250 µm.
The sections were then placed on a brass anvil and secured using the nail
varnish. This in turn was suspended above a diamond disc which was impregnated
with 15 mm diamond particles (Beuhler,
Illinois) on three accurately milled bearings
(Spheric Engineering, Ltd., Crawley,
UK) in circular
movement.
The anvil and the diamond plate were a total of 11.00 mm thick, so when
the smallest ball bearing was running free it produced a section of enamel that
was 80-100 mm thick. This thickness is recommmended for
optimum analysis by transverse microradiography.
Microradiography
The control and experimental sections were placed in a specially
fabricated radiographic plate-holding cassette, incorporating an aluminium
step-wedge (steps of 25 µm thickness). The mounted sections were scanned using
a Mustek 8000 SP, A4 colour scanner, running at 600 d.p.i. and the digitised
image retained to aid identification of individual sections on the exposed
plate. Following scanning, and processing, the microradiographs were then
subjected to image analysis using a computer programme written by de Josselin
de Jong.(11) The mineral content of the specimens was
expressed as mineral loss, and lesion depth. These parameters are useful to
describe important features of a lesion. A fall in mineral loss represents
remineralisation of the body of the surface of the lesion and a reduction in
depth represents remineralisation at the former advancing front of the lesion.
Statistical
analyses
For each lesion, the lesion depth (LD) and
mineral loss (ML), assessed by image analysis, was compared. Comparisons
between baseline controls (C) and exposure to the test cheeses and positive and
negative control (T) were examined using student paired t- tests.
As different tooth samples (enamel slabs)
were used on each occasion and hence different controls, the comparisons
between the different samples were made with the percentage change (DLD% and DML%)
in lesion depth and mineral loss (which is a change relative to the control).
The percentage difference = Control-Test x 100
Control
Results
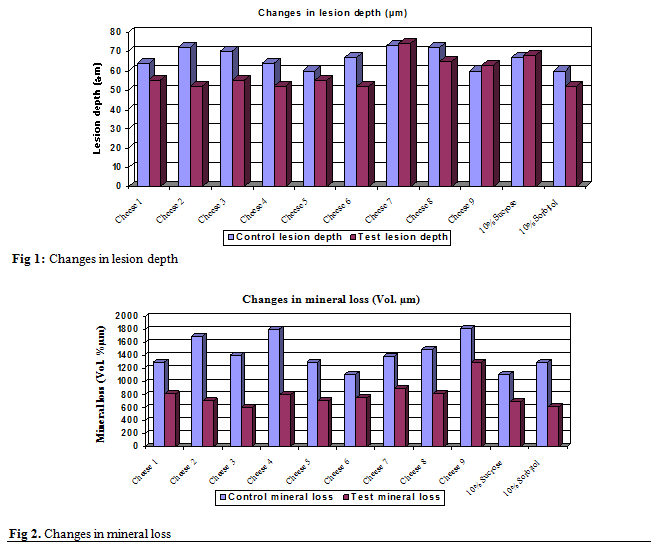
Changes in Lesion Depth
When the
subjects used the cheeses as the test group, the lesion depth (µm) revealed a
reduction between test and control
with cheese 2 (p< 0.001) and cheese 3 (p<0.05) which was statistically significant. With
cheese 1, cheese 3, cheese 4, cheese 5, cheese 6 and cheese 8, the lesion depth
also revealed a reduction between test and control slabs, but it was
statistically not significant (p>0.05). When the subjects used the negative
control (10% sorbitol) there was a reduction in the lesion depth, and it was
statistically not significant.
On the other hand, with cheese 7 and cheese
9, the lesion depth revealed an increase between the test and control slabs, but
it was statistically not significant. There was also an increase in the lesion
depth with the positive control (10% sucrose) and it was statistically not
significant. Table II shows the results of the paired t-test. Figure 1 shows
the differences in the lesion depth in the control and test samples.
Percentage
Difference in Lesion Depth
Similar results were evident when the
percentage differences in lesion depth were analysed. Remineralisation was
evident in the following order: with cheese 2, cheese 3, cheese 4, cheese 8,
cheese 1, cheese 5, cheese 6 and was also evident with 10% sorbitol. Demineralisation
was evident with cheese 7, cheese 9, and 10% sucrose.
Changes in Mineral Loss
When the
subjects used cheese as the test group, remineralisation was evident with
cheese 2, cheese 3, cheese 4, cheese 5, cheese 8 and cheese 9, this was
statistically significant (p<0.05). With cheese 1, cheese 6 and cheese 7,
remineralisation was also evident but this was not significant. When the
subjects used the positive and negative controls as test group, there was
evidence of remineralisation but it was not significant. Table III shows the
results of the paired t-test. Figure 2 shows the differences in the mineral
loss in the control and test samples.
Percentage Difference in
Mineral Loss
Analysing the percentage differences in
mineral loss also revealed similar results where remineralisation was evident
in the following order: with cheese 3, cheese 2, cheese 4, cheese 5, cheese 8,
cheese 1, cheese 9, cheese 6, and cheese 7.
Table II. Results of the
Paired t-Test for the Lesion Depth
|
|
|
|
Paired Differences
|
|
|
Cheese
|
Mean CLD°
|
Mean TLD°°
|
Mean
|
S.D.·
|
S.E. ··
Mean
|
95% confidence Interval of the Difference
|
Significance
(2-tailed)
|
|
|
|
|
|
|
|
Lower
|
Upper
|
|
|
Cheese 1
|
62.2
|
54.7
|
7.4
|
22.1
|
7.0
|
-8.4
|
23.2
|
0.315
(N.S.)*
|
|
Cheese 2
|
71.8
|
51.6
|
20.2
|
13.1
|
4.2
|
10.8
|
29.6
|
0.001
(S)
**
|
|
Cheese 3
|
69.4
|
54.7
|
14.7
|
16.3
|
5.1
|
3.1
|
26.3
|
0.019
(S)
|
|
Cheese 4
|
63.4
|
51.8
|
11.6
|
22.3
|
7.1
|
-4.3
|
27.6
|
0.133
(N.S.)
|
|
Cheese 5
|
59.5
|
54.5
|
5.0
|
13.7
|
4.3
|
-4.9
|
14.8
|
0.284
(N.S.)
|
|
Cheese 6
|
57.4
|
54.6
|
2.9
|
17.1
|
5.4
|
-9.4
|
15.1
|
0.610
(N.S.)
|
|
Cheese 7
|
63.6
|
63.7
|
-0.1
|
13.4
|
4.2
|
-9.7
|
9.5
|
0.985
(N.S.)
|
|
Cheese 8
|
71.0
|
62.3
|
8.7
|
12.4
|
4.0
|
-0.2
|
17.6
|
0.055
(N.S.)
|
|
Cheese 9
|
59.7
|
62.3
|
-2.7
|
8.7
|
2.8
|
-8.9
|
3.5
|
0.354
(N.S.)
|
|
|
58.1
|
58.9
|
-0.7
|
12.7
|
4.0
|
-9.8
|
8.4
|
0.865
(N.S.)
|
|
|
60.2
|
50.7
|
9.5
|
17.0
|
5.4
|
-2.6
|
21.6
|
0.110
(N.S.)
|
°= control lesion depth °°= test lesion depth ·= standard deviation ··= standard error
* =
non significant **=
significant
Table III. Results of Paired t-Test for Mineral Loss
|
|
|
|
Paired Differences
|
|
|
Cheese
|
Mean CML°
|
Mean TML°°
|
Mean
|
S.D. ·
|
S.E. ··
Mean
|
95% confidence Interval of the Difference
|
Significance
(2-tailed)
|
|
|
|
|
|
|
|
Lower
|
Upper
|
|
|
Cheese 1
|
1319.7
|
846.6
|
473.1
|
836.6
|
264.6
|
-125.4
|
1071.6
|
0.107
(N.S.)
*
|
|
Cheese 2
|
1687.2
|
669.1
|
1018.1
|
964.3
|
304.9
|
328.3
|
1707.9
|
0.009
(S)
**
|
|
Cheese 3
|
1398.3
|
592.8
|
805.5
|
312.6
|
98.9
|
581.9
|
1029.2
|
0.000
(S)
|
|
Cheese 4
|
1792.9
|
805.5
|
987.4
|
1080.3
|
341.6
|
214.6
|
1760.2
|
0.018
(S)
|
|
Cheese 5
|
1305.5
|
666.2
|
639.3
|
526.3
|
166.4
|
262.9
|
1015.8
|
0.004
(S)
|
|
Cheese 6
|
1125.1
|
757.9
|
367.2
|
584.9
|
1854.0
|
-51.3
|
785.6
|
0.078
(N.S.)
|
|
Cheese 7
|
1359.6
|
927.1
|
432.5
|
608.4
|
192.4
|
-2.7
|
867.8
|
0.051
(N.S.)
|
|
Cheese 8
|
1496.1
|
858.4
|
637.71
|
697.1
|
220.4
|
139.1
|
1136.4
|
0.018
(S)
|
|
Cheese 9
|
1823.0
|
1296.4
|
525.8
|
463.7
|
146.6
|
194.9
|
858.3
|
0.006
(S)
|
|
|
1039.3
|
768.5
|
270.9
|
632.6
|
200.1
|
-181.7
|
723.5
|
0.209
(N.S.)
|
|
|
1272.5
|
618.1
|
654.4
|
1104.7
|
349.4
|
-135.9
|
1444.7
|
0.094
(N.S.)
|
°= control mineral loss °°= test mineral loss ·= standard deviation ··= standard error * = non significant **= significant
Discussion
It was interesting to note that the cheeses
that caused significant remineralisation, had higher
calcium and protein content. These results support previous reports of the
cariostatic effect of cheese. Harper et
al.(12) in their study found that the most caries
inhibiting cheeses were the highest in protein and calcium phosphate content.
Eating cheese increases plaque calcium concentration.(13,14,15)
Higher concentration of ionic calcium and phosphate would produce a loading of
the plaque with calcium and phosphate. Calcium concentration in dental plaque
is an important determinant of the balance between enamel de- and
remineralisation since the rate of dissolution of enamel is determined mainly
by the level of saturation with calcium and phosphate ions of the tooth
environment.(16) Elevated levels of calcium and/or possibly
phosphorus, in dental plaque might inhibit demineralisation through a
common-ion effect, or might enhance remineralisation during periods of high pH.(15-17) In addition, there is evidence that high
extracellular free calcium concentrations may have bacteriostatic or even
bactericidal effects.(18) Protein
present in the cheese might prevent caries by adsorbing to the enamel surface
and interfering with ionic diffusion at the plaque enamel interface. This would
be possible during the first few hours before the formation of pellicle and
plaque.(15) The majority of protein in milk and cheese is
highly phosphorylated and with marked affinity for the hydroxyapatite. This
affinity could be so strong that the casein could displace non-phosphorylated
protein and high molecular weight dextrans. The phosphoproteins could also have
a regulatory role in the mineral process by regulating the movement of calcium
and phosphate between the crystal lattice and the hydration layer.(19)
On the other hand, other cheeses such as
cheese 8, which contained the highest percentage of casein phosphopeptides
(CPP) also, caused remineralisation. CPP by stabilising calcium phosphate could
facilitate high concentration of calcium and phosphate ions, which could
diffuse into the enamel subsurface lesion. CPP could also maintain the high
activities of the free calcium and phosphate ions during remineralisation
through the reservoir of bound amorphous calcium phosphate.(20) Another
possible explanation for the protective capacity may be related to the fat
content. Fat might have a protective role both physically and possibly by
inhibition of microbial metabolism.(21) Fat might also exert
a beneficial effect by acceleration of oral clearance of the carbohydrates,
thereby decreasing the cariogenic potential.(22) The
remineralisation seen with sucrose could be explained by the use of fluoridated
toothpaste by the volunteers. The study of (Duggal et al., 2001)(23) for the investigation of the
extent of demineralisation of enamel slabs in situ, using a sugar based solution, consumed in constant
amounts but varying frequency in subjects using fluoride toothpaste, showed a
net remineralisation of enamel slabs in subjects using sucrose solution with
the once, 2, and 5 times/day. So in this study it is not surprising to get
remineralisation with sucrose used 4 times/day. The results support previous
reports of the cariostatic potential of cheese.(15,19,24,25)
and suggest that a substantial portion of protection may be afforded through
prevention of enamel demineralisation and promotion of remineralisation, which
may be related to casein-calcium content of the cheese.
Recommendations
· Further research in
enamel demineralisation and remineralisation to establish the mineral loss or
gain with the cheeses, using different methods of assessment.
· Further research in
enamel demineralisation and remineralisation to establish the mineral loss or
gain with the cheeses, using non fluoridated toothpaste.
· Further research in
remineralisation testing to investigate the exact mechanism by which cheeses
can cause remineralisation.
Conclusion
Cheese can cause remineralisation of early
lesions.
References
1.Lingstrom
P, Holm AK, Mejare I, et al. Dietary factors
in the prevention of dental caries: a systematic review. Acta Odontol Scan
2003; 61:331-340.
2.Patro
BK, Kumar R, Goswami A. et al. Prevalence of
dental caries among adults and elderly in an urban resettlement colony of New
Delhi. Indian J Dent Res, 2008; 19(2): 95-98.
3.Ohlund
I, Holgerson PL, Backman B, et al. Diet
Intake and Caries Prevalence in Four-Year-Old Children Living in a
Low-Prevalence Country. Caries Res 2007; 41(1):26-33
4.Oshiro
M, Yamaguchi K, Takamizawa T, et al. Effect of CPP-ACP paste on tooth
mineralisation: an FE-SEM study. J Oral Sci 2007; 49(2): 115-120.
5.National Dairy Council, Huth PJ. The role of cheese in healthful diets. Dairy Council Digest
2009; 80(6): 31-36.
6.Jensen
ME, Donly K, Wefel JS. Assessment of the Effect of
Selected Snack Foods on the Remineralisation/Demineralisation of Enamel and
Dentin. J Contemp Dent Pract 2000; 1(3):1-17.
7.Toumba
KJ, Curzon MEJ. The Acidogenic Potential and
Cariogenicity of Cheese Using Plaque pH and Intra-Oral Cariogenicity Testing. Report
for the New Zealand
Dairy Board 1998.
8.Koulourides T, Bodden R, Keller
S, et al. Cariogenicity of Nine Sugars Tested with Intra-Oral Device
in Man. Caries Res 1976; 10: 427-441.
9.Pollard MA. Potential
Cariogenicity of Starches and Fruits as Assessed by the Plaque-Sampling Method
and an Intra-Oral Cariogenicity Test. Caries Res 1995; 29: 68-74.
10.Edgar WM. Distribution of Acetic Acid in
Enamel during Demineralisation in a Hydroxyl Ethyl Cellulose/Lactic Acid
System. In: Demineralisation and Remineralisation of the teeth. S. A.
Leach and W.M. Edgar, Eds., Oxford:
IRL Press, 1983: pp.145-152.
11.De Josselin de Jong E, Ten Bosch JJ, Noordmans
J. Optimised Microcomputer Guided Quantitative
Microradiography on Dental Mineralised Tissue Slices. Phys Med Boil
1987; 32: 887-899.
12.Harper D S, Osborn JC, Hefferren JJ, et al. Cariostatic
evaluation of Cheeses with Diverse Physical and Compositional Characteristics. Caries
Res 1986; 20: 123-130.
13.Rugg-Gunn AJ, Edgar WM, Geddes DAM, et al. The Effect of
Different Meal Patterns upon Plaque pH in Human Subjects. Br Dent J 1975;
139: 351-356.
14.Jenkins GN, Hargreaves JA. Effect of Eating
Cheese on Ca and P Concentrations of Whole Mouth Saliva and Plaque. Caries
Res 1989; 23: 159-164.
15.De Silva MF de A, Burgess RC, Sandham et al. Effects of Cheese Extract and
its Fractions on Enamel Demineralisation in
vitro and in vivo in Humans. J
Dent Res 1987; 66(10): 1527-1531.
16.Moynihan PJ, Ferrier S, Jenkins GN. The Cariostatic
Potential of Cheese: Cooked Cheese- containing Meals Increase Plaque Calcium
Concentration. Br Dent J 1999; 187: 664-667.
17.Jensen M, Wefel J.
Effect of Processed Cheese on Human Plaque pH and Demineralisation and
Remineralisation. Am J Dent 1990; 3: 217-223.
18.Rose RK. Binding Characteristics of Streptococcus mutans for Calcium and
Casein phosphopeptide. Caries Res 2000;
34(5): 418-427.
19.Thomson ME, Dever JG, Pearce EIF. Intra-oral Testing of Flavoured Sweetened Milk. N Z Dent J 1984: 44-46.
20.ReynoldsEC. Remineralisation of Enamel Subsurface Lesions by Casein
Phosphopeptide-stabilized Calcium Phosphate Solutions. J Dent Res 1997; 76(9):
1587-1595.
21.Jensen ME. Diet and dental caries. Dental
Clinics of North America. 1999; 43(4): 615-631.
22.
Rugg-Gunn AJ. Nutrition and Dental Health. Oxford Medical Publication 1993; pp.
293-259.
23.Duggal MS,
Toumba, KJ, Amaechi BT, et al.
Enamel demineralisation in situ with various
frequencies of carbohydrate consumption with and without fluoride toothpaste. J
Dent Res 2001; 80(8):1721-4.
24.Sela M, Gedalia
I, Shah L, et al. Enamel Rehardening with Cheese in Irradiated Patients. Am J Dent 1994; 7(3): 134-136.
25.Gedalia I,
Lewinstein I, Shapira L, et al.
Fluoride and Hard Cheese Exposure on Etched Enamel
in Neck-irradiated Patients in situ. J
Dent 1996; 24(5): 365-368.