ABSTRACT
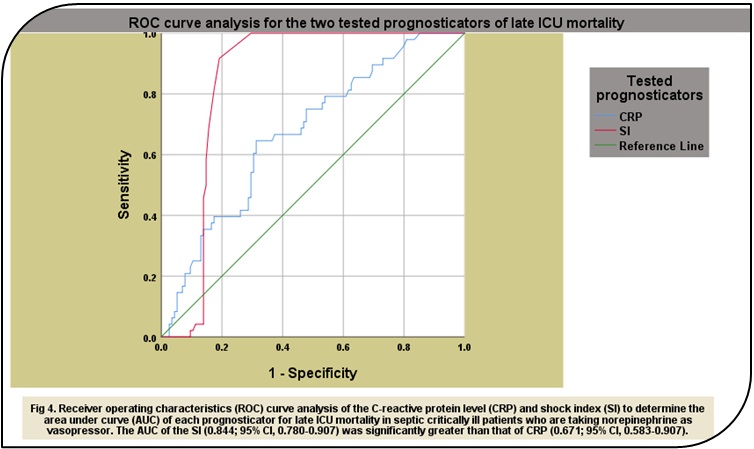
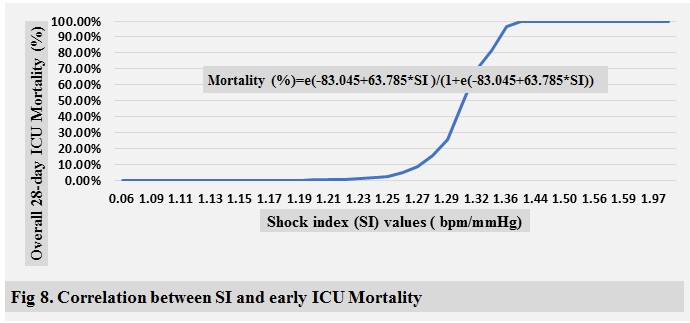
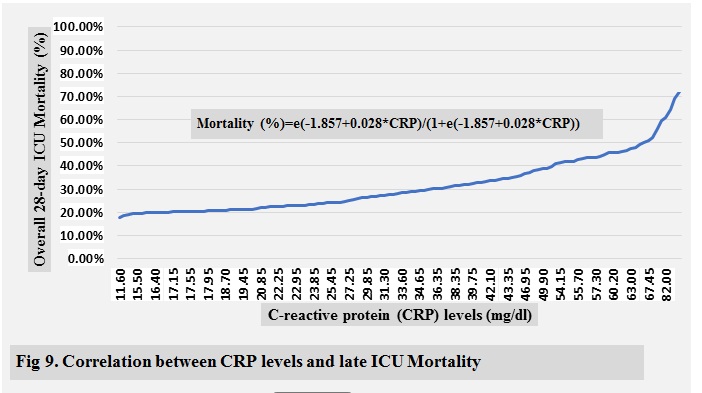
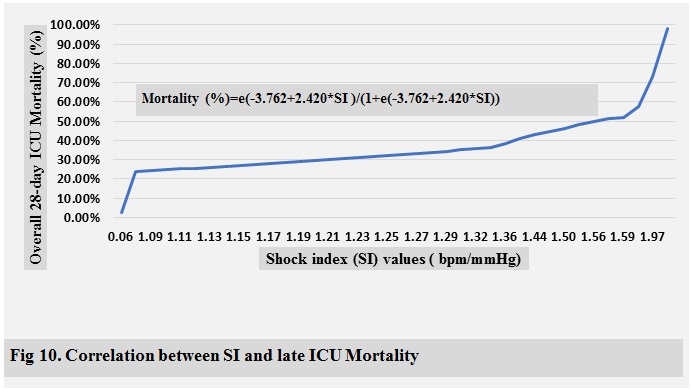
Objective: C-reactive
protein (CRP) and shock index (SI) have been previously shown to
identify high risk septic shock patients.Our objective was to compare the
ability of SI and CRP to predict the primary outcome of overall 28-day
mortality, and the secondary outcomes of early mortality (≤ 14 days), late
mortality (>14 days) in septic critically ill patients who are taking
norepinephrine as a vasopressor.
Methods: We performed a retrospective analysis of
patientsadmitted to our adult ICU between April 2017 and Sep 2018 who were meet
the inclusion criteria. Independent T-test, Mann Whitney U test, and χ2 test were used to express all patient
variables.A receiver operating characteristic (ROC) curve followed by
sensitivity analysis was generated to determine the predictive performances,
and the optimal cut-off values for CRP and SI. The binary logistic regression
model was used to generate CRP and SI predictive equations and correlation
plots for early, late, and overall 28-day ICU mortality.
Results : A total of 163 critically ill patients were
finally included in this study. The mean overall age was 58.37±9.96 years, and 112 subjects (68.71%)
were male. The early, late, and overall 28-day ICU mortality rate were9.82%,
29.45%, and 39.82%, respectively. SI and CRP were significantly higher in non-survivors (1.29±0.17
bpm/mmHg and 43.09±19.28 mg/dl, p<0.05) than in survivors (1.12±0.03
bpm/mmHg, and 28.38±14.38 mg/dl).
Conclusion: SI is an effective, no-cost bedside
modality, which is a realistic, reliable, and discriminative prognosticator
with high sensitivity, specificity, performance, and accuracy when compared
with CRP.
Key words: C-reactive protein, Shock index, Critically
ill patients, Norepinephrine.
JRMS December 2019;26(3):12-27/DOI: 10.12816/0054814
Introduction
Sepsis is a complex syndrome caused by the body’s systemic response to an infection with a major cause of high treatment cost, single or multiple organ dysfunction, morbidity, and mortality [1]. The importance of having reliable, cost effective, and easily attainable clinical prognostic indicators that would help to predictand differentiate the mortality risk of these critically ill patientsis invaluable within an Intensive Care Unit (ICU). C-reactive protein (CRP) is a useful positive acute-phase reactant marker that can predict morbidity and mortality among critically ill patients. However,the results of CRP and other severity indices of sepsis may not be immediately available upon request [2], potentially delaying effective dynamic risk stratification and goal directed management in these unstable studied cohort. Also, Shock index (SI), defined as heart rate (HR) over systolic blood pressure (SBP)is a readily and affordable attained comprehensive parameter that combines two physiological variables (HR and SBP) into a single ratio that has previously been shown to stratify and served as an early warning indicator of high risk haemorrhagic shock from various aetiologies when compared to other conventional vital signs [3-8].From previous studies, SI has never been compared with CRP for its value in predicting early mortality (≤ 14 days), late mortality (> 14 days), and overall 28-day mortality among septic critically ill patients who are taking nor-epinephrine. Our objective was to compare the mortality risk stratifying ability of SI and CRP regarding the primary outcome of overall 28-day mortality, and the secondary outcomes of early and late mortality and ICU length of stay.
Methods
Study
design and setting
This
was a single-centreobservational retrospective study conducted in the
department of adult ICU of King Hussein Medical Centre (KHMC) at Royal Medical
Services (RMS) in Jordan. This study was approved by our Institutional Review
Board (IRB), and a requirement for consent was waived owing to its
retrospective design. This study included a cohort of critically ill patients
admitted to our adult ICU via the emergency department (ED) or via other
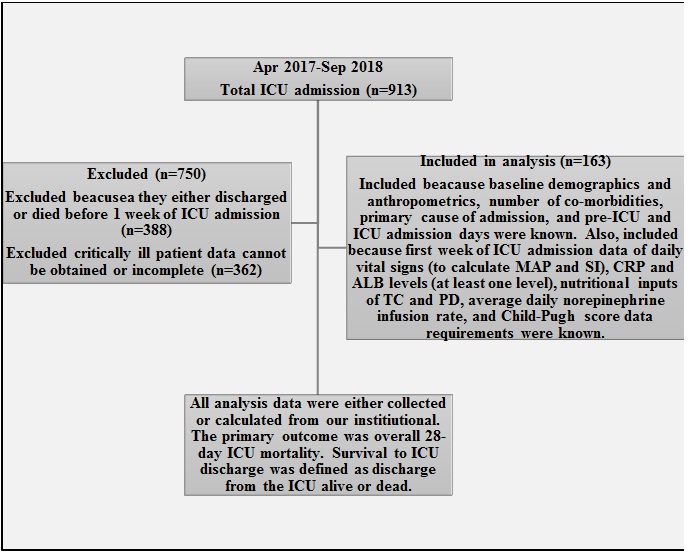
hospital wards with any medicalor surgical problems. Flow chart of critically
ill patient’s selection and data collection process is fully illustrated in (Figure1).
Statistical
analysis
All patient continuous variables were
expressed as mean± standard deviation by using the independent samples T-test
while categorical and ordinal variables were expressed as numbers with
percentages by using the χ2 test or as median (interquartile range)
by using the Mann-Whitney U test, respectively. Analysis values were compared
for the two tested groups (survivors vs. non-survivors) and the non-survival
group was further analysed after being divided into 2 subgroups, early (≤14
days) and late (>14 days) mortality. Univariate analysis was conducted first
followed by multivariate logistic regression for the most possible affected
patient’s variables associated with ICU mortality. A receiver
operating characteristic (ROC) curve followed by sensitivity analysis wasused
to determine the area under the ROC curves (AUROCs), predictive performances,
and the optimal cut-off values for CRP and SI. Youden indices, sensitivities,
specificities, positive and negative predictive values, and accuracy indices
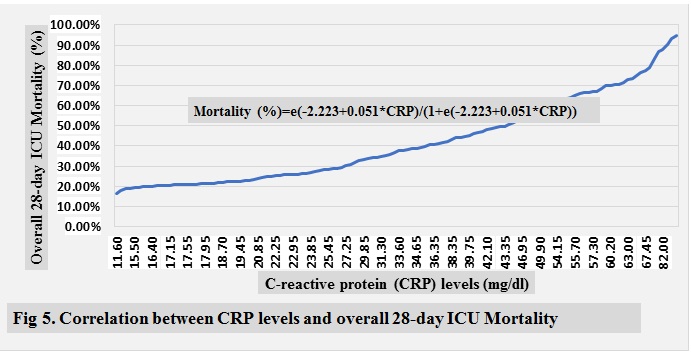
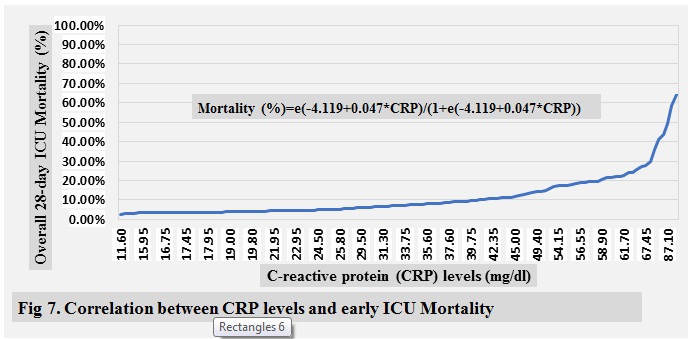
were also calculated. The binary logistic regression model was used to generate
CRP and SI predictive equations and correlation plots for early, late, and
overall 28-day ICU mortality. Statisticalanalyses were performed using IBM SPSS
ver. 25 (IBM Corp., Armonk, NY, USA) and P-values ≤0.05 were considered statistically
significant.
Results
Characteristics
of the subjects
The mean overall age was 58.37±9.96 years, and 112 subjects (68.71%) were male. The
overall 28-day ICU mortality rate was 39.26% (64 patients); in16 patients (9.82%),
this was early mortality and in 48 patients (29.45%) it was late mortality. Demographics, admission co-morbidities
and class, anthropometrics, and
follow-up comparison data of the study’s critically ill patients are fully
summarised in (Table I) and (Table II) , respectively.
|
Table I: Demographics and anthropometrics comparison of
study’s critically ill patients.
|
|
Variables
|
Total
(n=163)
|
Survivors
(n=99 )
|
Non-survivors
(n=64)
|
P-Value
|
|
Early
Mortality
(≤14
days)
(n=16)
|
Late
Mortality (>14 days)
(n=48)
|
|
Age
(Yrs)
|
58.37±9.96
|
58.55±9.948
|
58.09±10.053
|
0.92
NS
|
|
62.31±11.12
|
56.69±9.38
|
|
Gender
|
Male
|
112 (68.71%)
|
67 (67.68%)
|
45 (70.31%)
|
0.79
NS
|
|
11 (68.75%)
|
34 (70.83%)
|
|
Female
|
51 (31.29%)
|
32 (32.32%)
|
19 (29.69%)
|
|
5 (31.25%)
|
14 (29.17%)
|
|
Day(s)
Pre-ICU admission (day(s))
|
4.27±3.91
|
2.23±1.06
|
7.42±4.57
|
0.00
S
|
|
13.31±5.89
|
5.46±1.10
|
|
ICU
Stay day(s)
|
12.40±4.79
|
9.23±1.06
|
17.30±4.14
|
0.00
S
|
|
10.56±1.97
|
19.54±1.10
|
|
Hospital
Stay day(s)
|
16.67±6.81
|
11.46±2.12
|
24.72±1.98
|
0.00
S
|
|
23.87±3.93
|
25.00±0.00
|
|
Number
of comorbidities
|
0, 1
|
74 (45.39%)
|
52 (52.53%)
|
22 (34.38%)
|
0.03
NS
|
|
3 (18.75%)
|
19 (39.58%)
|
|
2 , 3, 4+
|
89 (54.60%))
|
47 (47.47%)
|
42 (65.63%)
|
|
13 (81.25%)
|
29 (60.42%)
|
|
Admission
class
|
Medical
|
105 (64.42%)
|
50 (50.51%)
|
55 (85.94%)
|
0.00
S
|
|
14 (87.5%)
|
41 (85.42%)
|
|
Surgical
|
58 (35.58%)
|
49 (49.49%)
|
9 (14.06%)
|
|
2 (12.5%)
|
7 (14.58%)
|
|
BW1(Kg)
|
74.17±10.24
|
74.63±10.06
|
73.45±10.56
|
0.61
NS
|
|
69.44±9.34
|
74.79±10.69
|
|
BMI1
(Kg/m²)
|
25.92±4.00
|
26.19±3.85
|
25.50±4.22
|
0.31
NS
|
|
24.11±4.28
|
25.97±4.14
|
|
28-day
ICU Survival
|
99
(60.74%)
|
|
28-day
ICU Mortality
|
Overall
Mortality
|
64 (39.26%)
|
|
Early
Mortality (≤14 days)
|
16
(9.82%)
|
|
Late
Mortality (>14 days)
|
48
(29.45%)
|
|
Values
are presented as mean±standard deviation or number (%).
Yrs:
Years.
Kg:
Kilogram.
m:
Meter.
BW1:
Actual body weight at admission.
BMI1:
Body mass index at admission.
|
ICU: Intensive care unit.
S: Significant (P-Value
<0.05).
NS: Non-significant (P-Value
>0.05).
n: Number of study’s
critically ill patients.
|
|
|
|
|
|
|
|
|
|
Table II: Follow-up data comparison of study’s critically ill
patients.
|
|
Variables
|
Total
(n=163)
|
Survivors
(n=99 )
|
Non-survivors
(n=64)
|
P-Value
|
|
Early
Mortality
(≤14
days)
(n=16)
|
Late
Mortality
(>14 days) (n=48)
|
|
Norepinephrine
Rate (mcg/min)
|
9.53±1.79
|
9.27±1.68
|
9.94±1.89
|
0.72
NS
|
|
9.94±2.49
|
9.94±1.67
|
|
GCS
(3-15)
|
12
(12-13)
|
12 (12-13)
|
12
(12-13)
|
0.34
NS
|
|
12
(12-13)
|
12
(12-13)
|
|
Child-Pugh
Score( 5-15)
|
6 (6-8)
|
6 (6-8)
|
6 (6-7)
|
0.09
NS
|
|
6 (6-7)
|
6 (6-7)
|
|
ALB
1 (g/dl)
|
2.75±0.32
|
2.63±0.20
|
2.94±0.39
|
0.00
S
|
|
3.28±0.46
|
2.82±0.28
|
|
Human
Albumin Dose (g/day)
|
16.99±5.11
|
18.89±3.16
|
14.06±6.09
|
0.00
S
|
|
9.38±6.80
|
15.63±5.01
|
|
ALB
(g/dl)
|
2.61±0.13
|
2.64±0.12
|
2.57±0.13
|
0.44
NS
|
|
2.55±0.11
|
2.57±0.14
|
|
CRP
(mg/dl)
|
34.16±17.93
|
28.38±14.38
|
43.09±19.28
|
0.01
S
|
|
50.55±21.88
|
40.61±17.89
|
|
SBP
(mmHg)
|
99.19±5.70
|
102.29±2.19
|
94.39±6.14
|
0.00
S
|
|
86.44±7.04
|
97.04±2.44
|
|
DBP
(mmHg)
|
49.19±5.70
|
52.29±2.19
|
44.39±6.14
|
0.00
S
|
|
36.44±7.04
|
47.04±2.44
|
|
MAP
(mmHg)
|
65.87±5.72
|
68.95±2.27
|
61.11±6.18
|
0.00
S
|
|
53.13±7.00
|
63.77±2.56
|
|
HR
(bpm)
|
117.16±4.67
|
114.76±1.19
|
120.88±5.55
|
0.00
S
|
|
128.06±7.15
|
118.48±1.20
|
|
SI
(bpm/mmHg)
|
1.19±0.14
|
1.12±0.03
|
1.29±0.17
|
0.00
S
|
|
1.49±0.23
|
1.22±0.04
|
|
TC
(Cal/day)
|
1327.32±261.96
|
1357.56±270.23
|
1280.54±243.32
|
0.58
NS
|
|
1181.86±269.47
|
1313.43±227.52
|
|
PD
(g/100Cal/day)
|
3.64±0.63
|
3.72±0.74
|
3.50±0.36
|
0.00
S
|
|
3.46±0.42
|
3.52±0.35
|
|
Values are presented as mean ± standard
deviation, median (range), or number (%).
n: Number of study’s critically ill
patients.
bpm: beat per minute.
mcg: microgram.
min: minute.
1: At admission.
|
S: Significant (P-Value <0.05).
NS: Non-significant (P-Value >0.05).
MAP: Mean arterial pressure.
HR: Heart rate.
SBP: Systolic blood pressure.
DBP: Diastolic blood pressure.
|
Cal: Kcal.
TC: Total calories.
PD: Protein density.
SI: Shock index.
CRP:C-reactive protein.
GCS: Glasgow coma scale.
ALB: Albumin level.
|
Mortality was significantly higher in medical than surgical critically ill patients. Baseline pre-ICU admission days and number of co-morbidities were also significantly higher in non-survivors than survivors. There were insignificant differences between the two groups regarding average child-Pugh score, average Glasgow coma scale (GSC), and average norepinephrine infusion rate. Despite baseline albumin levels (ALB1)being significantly higher in non-survivors (2.94±0.39 g/dl)than survivors (2.63±0.20 g/dl), survivors had significantly higher average administered human albumin dosesand average protein density (PD) inputs (18.89±3.16 g/day and 3.72±0.74 g/100 Cal, respectively)than non-survivors (14.06±6.09 g/day and3.50±0.36 g/100 Cal). SI, HR, and CRP were significantly higher in non-survivors (1.29±0.17 bpm/mmHg, 120.88±5.55 bpm, and 43.09±19.28 mg/dl, respectively) than in survivors (1.12±0.03 bpm/mmHg, 114.76±1.19 bpm, and 28.38±14.38 mg/dl). In contrast, all haemodynamic parameters of SBP, diastolic blood pressure (DBP), and mean arterial pressure (MAP) had significantly higher values in survivors (102.29±2.19 mmHg, 52.29±2.19 mmHg, and 68.95±2.27 mmHg, respectively) than in non-survivors (94.39±6.14 mmHg, 44.39±6.14 mmHg, and 61.11±6.18 mmHg, respectively). SI and CRP were significantly higher in early non-survivors (1.49±0.23 bpm/mmHg and 50.55±21.88 mg/dl, respectively) than in late non-survivors (1.22±0.04 bpm/mmHg and 40.61±17.89 mg/dl, respectively).
Logistic
regression analysis
In the univariate analyses, child-Pugh score, CRP,
SBP, DBP, MAP, and SI showed statistically significant associations with early
(OR, 0.07,
0.47,0.45, 0.45, 0.45, and 5.0*1028, respectively), late (OR,
0.31,0.87,0.91, 0.91, 0.92, and 11.25,
respectively), and overall 28-day ICU mortality (OR,
0.17, 0.78, 0.42, 0.42, 0.45, and 1.6*1038, respectively),while total calorie (TC) inputs and HR
showed only statistically significant associations with early mortality (OR, 0.99) and late mortality (OR, 1.08), respectively. Average albumin levels
(ALB) during the first week of ICU admission showed astatistically significant
association with both early (OR, 248.65) and overall 28-day ICU mortality (OR, 47.06). After adjusting for these variables,
only SI still showed a statistically significant association with early, late,
and overall 28-day ICU mortality,while CRP still showed statistically
significant association with only overall 28-day ICU mortality. The odd ratios
(ORs) of early, late, and all-cause 28-day ICU mortality events are shown in (Table III).
|
Table III: ORs for early, late, and all-cause in-ICU mortality
events
|
|
|
Variable
|
Univariate
|
Multivariate
|
|
|
OR
|
95% CI
|
P-value
|
OR
|
95% CI
|
P-value
|
|
|
Age
(Yrs)
|
Overall
28-day mortality
|
0.99
|
0.96-1.03
|
0.78 (NS)
|
----
|
-----
|
-----
|
|
|
Early
mortality (≤ 14 days)
|
1.05
|
0.99-1.10
|
0.09 (NS)
|
----
|
-----
|
-----
|
|
|
Late
Mortality (> 14 days)
|
0.98
|
0.94-1.01
|
0.17 (NS)
|
----
|
-----
|
-----
|
|
|
Gender
(Male)
|
Overall
28-day mortality
|
1.13
|
0.57-2.24
|
0.72 (NS)
|
----
|
-----
|
-----
|
|
|
Early
mortality (≤ 14 days)
|
1.00
|
0.33-3.05
|
0.99 (NS)
|
----
|
-----
|
-----
|
|
|
Late
Mortality (> 14 days)
|
1.15
|
0.55-2.40
|
0.71 (NS)
|
----
|
-----
|
-----
|
|
|
BMI
(Kg/m²)
|
Overall
28-day mortality
|
0.96
|
0.84-1.04
|
0.28 (NS)
|
----
|
-----
|
-----
|
|
|
Early
mortality (≤ 14 days)
|
0.88
|
0.76-1.01
|
0.06 (NS)
|
----
|
-----
|
-----
|
|
|
Late
Mortality (> 14 days)
|
1.00
|
0.92-1.09
|
0.92 (NS)
|
----
|
-----
|
-----
|
|
|
Child-Pugh
score (5-15)
|
Overall
28-day mortality
|
0.17
|
0.06-0.45
|
0.00 (S)
|
----
|
-----
|
-----
|
|
|
Early
mortality (≤ 14 days)
|
0.07
|
0.01-0.68
|
0.02 (S)
|
----
|
-----
|
-----
|
|
|
Late
Mortality (> 14 days)
|
0.31
|
0.12-0.82
|
0.02 (S)
|
----
|
-----
|
-----
|
|
|
PD
(g/100
Cal/day)
|
Overall
28-day mortality
|
0.52
|
0.28-0.97
|
0.52 (NS)
|
----
|
-----
|
-----
|
|
|
Early
mortality (≤ 14 days)
|
0.503
|
0.16-1.63
|
0.25 (NS)
|
----
|
-----
|
-----
|
|
|
Late
Mortality (> 14 days)
|
0.59
|
0.31-1.16
|
0.13 (NS)
|
----
|
-----
|
-----
|
|
|
TC
(Cal/day)
|
Overall
28-day mortality
|
0.99
|
0.99-1.00
|
0.07 (NS)
|
-----
|
-----
|
-----
|
|
|
Early
mortality (≤ 14 days)
|
0.99
|
0.99-1.00
|
0.02 (S)
|
----
|
-----
|
-----
|
|
|
Late
Mortality (> 14 days)
|
1.00
|
0.99-1.00
|
0.66 (NS)
|
----
|
-----
|
-----
|
|
|
ALB
(g/dl)
|
Overall
28-day mortality
|
47.06
|
10.50-210.91
|
0.00 (S)
|
----
|
-----
|
-----
|
|
|
Early
mortality (≤ 14 days)
|
248.65
|
24.66-2507.44
|
0.00 (S)
|
----
|
-----
|
-----
|
|
|
Late Mortality
(> 14 days)
|
2.48
|
0.89-6.89
|
0.08 (NS)
|
----
|
-----
|
-----
|
|
|
CRP
(mg/dl)
|
Overall
28-day mortality
|
0.78
|
0.62-0.83
|
0.00 (S)
|
0.10
|
0.01-0.72
|
0.02 (S)
|
|
|
Early
mortality (≤ 14 days)
|
0.47
|
0.34-0.66
|
0.00 (S)
|
----
|
-----
|
-----
|
|
|
Late
Mortality (> 14 days)
|
0.87
|
0.77-0.98
|
0.03 (S)
|
----
|
-----
|
-----
|
|
|
SBP
(mmHg)
|
Overall
28-day mortality
|
0.42
|
0.32-0.55
|
0.00 (S)
|
----
|
-----
|
-----
|
|
|
Early
mortality (≤ 14 days)
|
0.45
|
0.28-0.74
|
0.00 (S)
|
----
|
-----
|
-----
|
|
|
Late
Mortality (> 14 days)
|
0.91
|
0.86-0.97
|
0.00 (S)
|
----
|
-----
|
-----
|
|
|
DBP
(mmHg)
|
Overall
28-day mortality
|
0.42
|
0.32-0.55
|
0.00 (S)
|
----
|
-----
|
-----
|
|
|
Early
mortality (≤ 14 days)
|
0.45
|
0.28-0.74
|
0.00 (S)
|
----
|
-----
|
-----
|
|
|
Late
Mortality (> 14 days)
|
0.91
|
0.86-0.97
|
0.00 (S)
|
----
|
-----
|
-----
|
|
|
MAP
(mmHg)
|
Overall
28-day mortality
|
0.45
|
0.35-0.58
|
0.00 (S)
|
----
|
-----
|
-----
|
|
|
Early
mortality (≤ 14 days)
|
0.45
|
0.28-0.73
|
0.00 (S)
|
----
|
-----
|
-----
|
|
|
Late
Mortality (> 14 days)
|
0.92
|
0.86-0.97
|
0.01 (S)
|
----
|
-----
|
-----
|
|
|
HR
(bpm)
|
Overall
28-day mortality
|
5.3*109
|
0.00-#
|
0.989(NS)
|
----
|
-----
|
-----
|
|
|
Early
mortality (≤ 14 days)
|
3.6*1014
|
0.00-#
|
0.98 (NS)
|
----
|
-----
|
-----
|
|
|
Late
Mortality (> 14 days)
|
1.08
|
1.01-1.17
|
0.03 (S)
|
----
|
-----
|
-----
|
|
|
SI
(bpm/mmHg)
|
Overall
28-day mortality
|
1.6*1038
|
5.9*1022-4.4*1053
|
0.00 (S)
|
2.9*10124
|
7.0*1027-1.2*10219
|
0.01 (S)
|
|
|
Early
mortality (≤ 14 days)
|
5.0*1028
|
4.9*1010-5.1*1048
|
0.01 (S)
|
5.0*1028
|
4.9*1010-5.1*1048
|
0.01 (S)
|
|
|
Late
Mortality (> 14 days)
|
11.25
|
8.93-41.71
|
0.04 (S)
|
11.25
|
8.93-41.71
|
0.04 (S)
|
|
|
OR: Odds ratio.
Yrs: Years.
Kg: Kilogram.
m: Meter.
CI, confidence interval.
BMI: Body mass index.
1: At admission.
|
Cal: Kcal.
PD: Protein density.
TC: Total calories.
#: Extremely large number.
ALB: Albumin.
CRP: C-reactive protein.
|
SBP: Systolic blood pressure.
DBP: Diastolic blood pressure.
MAP: Mean arterial pressure.
HR: heart rate.
bpm: Beat per minute.
SI: Shock index.
|
|
|
|
|
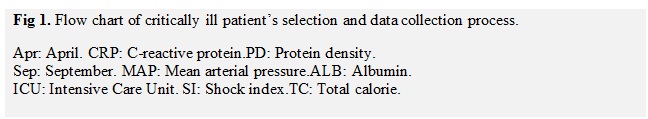
Prognostic
value of the CRP and SI
(Table IV) shows the optimal cut-off point,
sensitivity (TPR), specificity (TNR), Youden index (YI), positive and negative
predictive values (PPV and NPV), accuracy index (AI), and expected mortality
rate of both tested prognostic indicators. The best cut-off values for CRP and SI in our study
were 29.5 mg/dl and 1.29 bpm/mmHg, respectively, for early mortality, 34 mg/dl
and 1.18 bpm/mmHg, respectively, for late mortality, and 33.60 mg/dl and 1.18
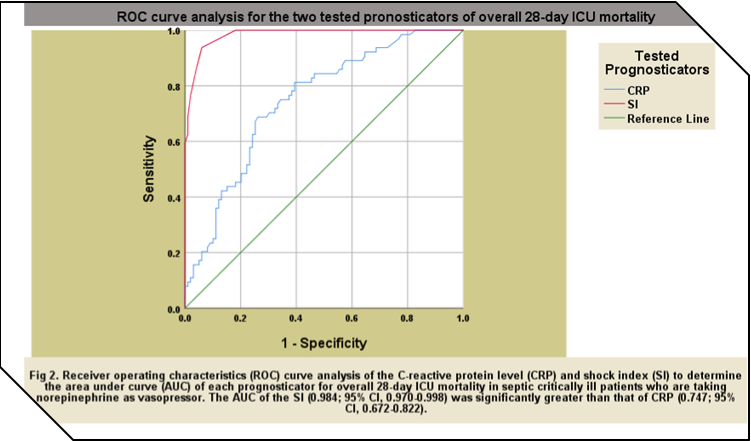
bpm/mmHg, respectively, for overall 28-day ICU mortality. The AUROCs of SI in
this study were significantly greater than those of CRP in all mortality groups
with 0.996; 95% CI, 0.990-1.00 vs. 0.764; 95% CI, 0.675-0.853, respectively,
for early mortality, 0.844; 95% CI, 0.780-0.907 vs. 0.671; 95% CI, 0.583-0.907,
respectively, for late mortality, and 0.984; 95% CI, 0.970-0.998 vs. 0.747; 95%
CI, 0.672-0.822, respectively, for overall 28-day ICU mortality.The ROC curve
analyses and mortality correlations of CRP and SI for early, late, and 28-day
ICU mortality are shown in ( Fig 2-10 )
|
Table IV. Optimal
cut-off point, sensitivity, specificity, positive and negative predictive
values, Youdenand accuracy indices, and expected early, late, and 28-day ICU
mortality of CRP and SI.
|
|
Prognostic
Indicator
|
Cut-off
|
TPR
|
FPR
|
YI
|
TNR
|
PPV
|
NPV
|
AI
|
% Mortality
|
|
CRP
(mg/dl)
|
Overall 28-day
mortality
|
33.60
|
68.80%
|
26.30%
|
42.50%
|
73.70%
|
62.84%
|
78.51%
|
71.78%
|
37.53%
|
|
Early mortality
(≤ 14 days)
|
29.50
|
100.00%
|
44.90%
|
55.10%
|
55.10%
|
59.01%
|
100.00%
|
72.73%
|
6.11%
|
|
Late Mortality
(> 14
days)
|
34.00
|
64.60%
|
31.30%
|
33.30%
|
68.70%
|
57.16%
|
75.01%
|
67.09%
|
28.80%
|
|
SI (bpm/
mmHg)
|
Overall 28-day
mortality
|
1.18
|
93.80%
|
6.10%
|
87.70%
|
93.90%
|
90.86%
|
95.91%
|
93.86%
|
41.59%
|
|
Early mortality
(≤ 14 days)
|
1.29
|
100.00%
|
1.40%
|
98.60%
|
98.60%
|
97.88%
|
100.00%
|
99.15%
|
25.33%
|
|
Late Mortality (> 14 days)
|
1.18
|
91.70%
|
19.10%
|
72.60%
|
80.90%
|
75.63%
|
93.78%
|
85.14%
|
28.53%
|
|
CRP:
C-reactive protein.
SI: Shock
index.
TPR: True
positive rate (sensitivity)
FPR: False
positive rate.
YI: Youden
index.
|
PPV: Positive predictive value.
NPV: Negative predictive value.
AI: Accuracy index.
TNR: True negative ratio (specificity).
bpm: Beat per minute.
|
Discussion
The present study included septic mechanically ventilated critically ill patients who are taking norepinephrine as a vasopressor at an overall average rate of 9.53±1.79 mcg/min. To the best of our knowledge, this is the first study to address the correlations between SI, CRP, and mortality. In the context of ever-shrinking resources, early stratification with fast, affordable, valid, reliable, and discriminativepredictive tools are critically needed in this unstable, high acuity, and high uncertainty status of the septic critically ill to avoid any potentialdelay or under-triaging while appropriately assigning a higher priority to sicker patients [9].SI emphasises current physiologic no-cost bedside triage dynamic rather than static toolsthat can be used at any time for triage decisions regarding septic patients while waiting for the results of other diagnostics, especially white blood cells (WBCs) with differential, CRP, and procalcitonin (PCT) [10-19]. After careful analysis of the data, SI shows higher sensitivity, performance, specificity, positive and negative predictive value, and accuracy than CRP in both late (91.70% vs. 64.60%,72.60% vs. 33.30%, 80.90% vs. 68.70%, 75.63% vs. 57.16%, 93.78% vs. 75.01%, and 85.14% vs. 67.09%, respectively) and 28-day ICU mortality (93.80% vs. 68.80%,87.70% vs. 42.50%,93.90% vs. 73.70%,90.86% vs. 62.84%, 95.91% vs. 78.51%, and 93.86% vs. 71.78%, respectively),while in the case of early mortality, SI shows higher performance, specificity, positive predictive value, and accuracy than CRP (98.60% vs. 55.10%, 98.60% vs. 55.10%, 97.88% vs. 59.01%, and 99.15% vs.72.73%, respectively).This study demonstrates a vast difference insignificance and predictive values of SI when compared with CRP, possibly due to the fact that norepinephrine, which was used as a vasopressor in these septic mechanically ventilated critically ill studied patients, givesrise to alterations of physiological parameters of HR and SBP, making the SI indicator a realistic reflection of the septic patients and a more reliable predictive prognosticator compared to CRP.
In summary, SI is an effective, no-cost bedside modality, realistic, reliable, and discriminativeprognosticator with high sensitivity, specificity, performance, and accuracy when compared with CRP to predict early, late, and overall 28-day ICU mortality in septic mechanically ventilated critically ill patients who are taking norepinephrine as a vasopressor. SI may be used as an additional or readily available red flag bedside assessment tool for severe disease. This study is limited by its retrospective design, using single-centre data, including only septic mechanically ventilated ICU patients. Nonetheless, our centre isan experienced and high-volume unit, so our data may be useful in other centres.A larger, multisite, and prospective study is needed to control for multiple confounders and to clarify the causation between SI, CRP, and mortality and therole in resource utilisation, and risk stratification of septic patients.
REFERENCES
1.Shapiro NI, Howell MD, Bates D, et al. The association of sepsis syndrome and organ dysfunction with mortality in emergency department patients with suspected infection. Ann Emerg Med. 2006; 48:583-590.
2.Dellinger RP, Carlet JM, Masur H, et al. Surviving Sepsis Campaign guidelines for management of severe sepsis and septic shock. Crit Care Med 2004; 32: 858-73.
3.Birkhahn Robert H, Theodore J Gaeta, Shawn K Van Deusen, John Tloczkowski. The ability of traditional vital signs and shock index to identify ruptured ectopic pregnancy. American Journal of Obstetrics and Gynecology 2003; 189(5): 1293-6.
4.Zarzaur Ben L., Martin A. Croce, Peter E. Fischer, Louis J. Magnotti, Timothy C. Fabian.New vitals after injury: Shock index for the young and age x shock index for the old. Journal of Surgical Research 2008;147(2): 229-36.
5.Brasel KJ, Guse C, Gentilello LM, et al. Heart rate: Is it truly a vital sign? J Trauma 2007; 62: 812. 12.
6.Victorino GP, Battistella FD, Wisner DH. Does tachycardia correlate with hypotension after trauma? J Am CollSurg 2003; 196: 679.
7.Rady M, Smithline H, Blake H, et al. A comparison of the shock index and conventional vital signs to identify acute, critical illness in the emergency department. Ann Emerg Med. 1994; 24:685-690.
8.Cannon CM, Braxton CC, Kling-Smith M, Mahnken JD, Carlton E, Moncure M. Utility of the shock index in predicting mortality in traumatically injured patients. JTrauma. 2009;67(6):1426–1430.
9.Horeczko T, Enriquez B, McGrath NE, et al. The paediatric assessment triangle: Accuracy of its application by nurses in triage. J EmergNurs. 2012. In press.
10.Becker KL, Snider R, Nylen ES. Procalcitonin assay in systemic inflammation, infection, and sepsis: clinical utility and limitations.Crit Care Med. 2008;36:941-52.
11.Castelli GP, Pognani C, Cita M,Paladini R. Procalcitonin as a prognostic and diagnostic tool for septic complications after major trauma. Crit Care Med. 2009;37:1845-9.
12.Becker KL, Snider R, Nylen ES. Procalcitonin in sepsis and systemic inflammation: a harmful biomarker and a therapeutictarget. Br J Pharmacol. 2010;159:253-64.
13.Castelli GP, Pognani C, Meisner M, Stuani A, Bellomi D, Sgarbi L. Procalcitonin and C-reactive protein during systemic inflammatory response syndrome, sepsis and organ dysfunction. Crit Care 2004;8:234–42.
14.Meidani M, Khorvash F, Abolghasemi H, Jamali B. Procalcitonin and quantitative C-reactive protein role in the early diagnosis of sepsis in patients with febrile neutropenia. South Asian J Cancer 2013;2:216–30.
15.Magrini L, Travaglino F, Marino R, Ferri E, De Berardinis B, Cardelli P, et al. Procalcitonin variations after Emergency Department admission are highly predictive of hospital mortality in patients with acute infectious diseases. Eur Rev Med PharmacolSci 2013;17(Suppl 1):133–42.
16.Tang H, Jing J, Bo D, Xu D. Biological variations of leukocyte numerical and morphologic parameters determined by UniCelDxH 800 hematologyanalyzer. Arch Pathol Lab Med 2012;136:1392–6.
17.surgerySapin F, Biston P, Piagnerelli M. Predictive value of C-reactive protein in critically ill patients after abdominal surgery. Clinics (Sao Paulo). 2017;72(1):23-29. Published 2017 Jan. doi:10.6061/clinics/2017(01)05
18.Oh TK, Song IA, Lee JH. Clinical usefulness of C-reactive protein to albumin ratio in predicting 30-day mortality in critically ill patients: A retrospective analysis. Sci Rep. 2018;8(1):14977
19.Christophe Lelubre,Sophie Anselin et al . Interpretation of C-Reactive Protein Concentrations in Critically Ill Patients, BioMed Research International 2013:124021, 11